- Original research article
- Open access
- Published:
Assessment of scaling formation during solar desalination using PHREEQC modeling in El Gebail and El Qaa plain areas: southwest Sinai
Renewables: Wind, Water, and Solar volume 3, Article number: 4 (2016)
Abstract
The fresh water needs of mankind in regions under severe stress due to scarcity of water and energy can be satisfied if saline water which is available is converted to potable water by solar desalination. Beside salinity, scaling formation is one of the major problems that slow down heat transfer and cause system failures. Prevention and minimizing scale formation is highly important in the thermal solar desalination. So, the present study aims to studying individually the chemical characteristics affecting groundwater quality in inland and coastal regions of El Gebail and El Qaa plain areas southwest Sinai to evaluate and map them as feed water for thermal desalination plants. In addition, preparation of scale prediction modeling to estimate deposits on heat exchanger surfaces in distillation units has also been covered. Twenty-four water samples were collected from the study area and chemically analyzed. Water samples in El Qaa plain are of good water quality and can be used for different purposes. Water samples in El Gebail have excess salts for major wells and cannot be used without desalination. Saturation indices for different minerals are carefully studied. The scale prediction based on PHREEQC modeling was employed. In addition, laboratory experimental for evaluation scale precipitation after different recovery percentages of pure water from saline water was used. Results indicate that about 31 % of water samples in El Gebail region are faint coating, 38 % are mild scale forming, and 31 % are mild corrosion. Also, using PHREEQC for simulated evaporation with continuous water feeding of water sample can be used as a technique to quantitatively estimate the impending scale formation in solar desalination systems, which is very important to discover the best location for carrying out solar desalination. Also, the best operating procedure conditions and the best system designs were identified.
Background
Desert communities, of coastal regions and isolated inland in South Sinai, suffer from scarcity of water and energy. Moreover, these communities struggle to balance declining water supplies for each person and the demands of a rapidly rising population, where the assessment of fresh water demand capacity in South Sinai in 2020 is 600000(m3/d) (El-Sadek 2010; Elewa and Qaddah 2011).
South Sinai regions generally have a great solar energy utilization potential, where the monthly mean of the daily clearness index [(KTd) m] value is larger than 0.65 in summers. This implies that 65 % of the extraterrestrial irradiation reaches the ground. The lowest values of 0.55 are attained in November and December. (El-Sadek 2010; Diabate et al. 2004), as solar desalination concepts and methods are specifically suited to supply dry regions with freshwater. The key point is that efficient and environment friendly solar energy coupled with desalination technologies could be an appropriate alternative to produce fresh water on both small and medium scales to conventional humidification and dehumidification solar desalination systems (Shatat et al. 2013). More to the point salinity, other impurities in water come from many sources. It is important to realize the role of these impurities in desalination processes. The recovery of pure water from saline water results in the increased concentration of brine, thus increasing the potential for fouling due to the precipitation of scale-forming salts/coagulation and the deposition of colloidal matter from brine. The heat exchangers and tubes fouling are complex observable facts involving the deposition of several different types of deposits on the surfaces. The composite of such deposits on heat exchanger surfaces in distillation systems leads to poorer thermal operation and unscheduled shutdowns of heat exchanger(Rahman and Amjad 2009; Vidojkovic et al. 2013). Scale prevention is technically and economically more effective than redissolution once scale has formed, and scale prediction is an essential step in scale prevention (Huber et al. 2014; Villaf 2005). The saturation index utilization has been successful to predict scaling in a wide range of industrial applications(Ferguson 2011; Thompson et al. 2013). This reveals that the method is universal and applicable to several water qualities, provided that the analytical characterization is as detailed as possible and dependable.
The degree of water saturation with respect to a mineral is given by SI = log (KIAP/KSP), where KIAP is the ionic activity product, KSP is the solubility product, and SI is the saturation index of the concerned mineral. When SI is equal to zero, the water is at equilibrium or saturated with the mineral phase; SI value less than zero (negative value) indicates under-saturation, and the mineral phase tends to dissolve; and SI value over zero (positive value) shows super-saturation, and the mineral phase tends to precipitate.
Various dedicated chemical programs may be used to calculate saturation indices: CHEMSHEET (Koukkari et al. 2000), FRENCHCREEK (Ferguson 2002), OLI(Wang 2010), PHREEQC (Parkhurst and Appelo 1999; Huff 2004), NETPATH-WIN (El-Kadi et al. 2010), and others.
Saturation indices were used as an indicator of water corrosivity or scale formation. Table 1 represents a typical range of SI of calcite that may be encountered in a drinking water and a description of the nature of the water as well as the general recommendations regarding treatment (W.U.; C.E.G; G.S.E. Dept. 2002).
In this work, the saturation indices (SI) of the major mineral phases in the investigated groundwater samples were calculated using the software package (NETPATH-WIN), and all calculations, of simulated evaporation and continuous water feed for evaporation tower in solar desalination system, were performed with PHREEQC v2. This powerful software can handle solid–liquid–gas phase calculations, mixing of solutions, solution evaporation, addition of reactants, ion-exchange and surface complexation, kinetic rates, influence of temperature, and much more.
The present study was interested in evaluating water resources and mapping them as feed water for thermal desalination plants. Moreover, PHREEQC was used for scale prediction modeling to estimate deposits which can be observed, on heat exchanger surfaces in mixing tank and evaporation tower of a thermal desalination unit using the solar-power, after few distillation cycles. This desalination unit treats groundwater wells that have high salinity more than 6000 mg/l to get water with much lower salinity (<200 mg/L). The unit has three major components: solar collectors, evaporation tower, and condensation tower. It consists of heating brackish or saline water by solar collectors via a heat exchanger. The temperature varies between 50 and 90 °C. The main idea behind the solar humidification–dehumidification process is that the moisture carrying capacity of the air increases with the increase in temperature. When hot air comes in contact with saline water which is sprayed in the evaporator, a certain quantity of vapor is extracted by the air which could be recovered by condenser (Sharon and Reddy 2015). The brine discharged from the evaporator would be mixed with the feed water in closed water cycle, while in case of open water cycle the brine would be discharged in every stage of operation. The schematic representation of the closed air system, solar collectors with heat exchanger in closed cycle, and (open/closed) feed water cycle system is shown in Fig. 1.

The Perspectives of solar-powered desalination unit
The study area lies on the eastern side of the Suez Gulf, between Lat. 28°07′ and 28°21′ N and Long. 33°34′ and 33°41′ E on Sinai Peninsula (Fig. 2). The study area is inhabited by Bedouins who live around the boreholes from which they get fresh water for drinking and domestic purposes. In addition, the fresh water is transported from boreholes in pipelines to El-Tor and Sharm El-Sheikh cities. However, changes in the ground water flow system has resulted in salinization, with the dissolution of salts and leaching of saline stagnant water from coral reef deposits. The eastern part of the study area contains a fresh water aquifer, but the southern part overlies a salt water aquifer.

Wells’ location map of the study area
Methodology
Chemical analyses
Chemical analyses for all the collected groundwater samples were carried out according to the methods adopted by US. Geological survey, (Rainwater and Thatcher 1960; Fishman and Friedman 1985; American Society for Testing and Materials ASTM, 2002). These analyses include the determination of total dissolved solids (TDS), pH, EC, Cations, (Ca2+, Mg2+, Na+, K+), anions (CO3 2−, HCO3 −, SO4 2−, Cl−), and heavy metals (Fe, Cd, Co, Pb, Cr, Cu, Zn, Mn, Si, Al, and Ni) as shown in (Figs. 3, 4, 5). The chemical data collected from the analyses are registered in milligrams per liter (mg/l or ppm), milli-equivalents per liter (meq/l or epm), and percentage (%).

(TDS) and pH of the samples in the area

Major ion composition of the samples in the study area

Concentration of minor and trace constituents in mg/l
The analyses include site measurement of carbonates (CO3 2−) and bicarbonates (HCO3−) ions titrimetrically. The pH and EC of water samples were measured instrumentally using pH meter, (3510, Jenway, UK) and EC meter, (Orion 150A+, Thermo Electron Corporation, USA), respectively. Sodium (Na+), potassium (K+), Sulfate (SO4 2−), chloride (Cl−), calcium (Ca2+), and magnesium (Mg2+) ions were determined using ion chromatography (Dionex ICS-1100 Ion Chromatography Reagent-Free IC System). The heavy metals which include cadmium (Cd), cobalt (Co), iron (Fe), manganese (Mn), lead (Pb), nickel (Ni), chromium (Cr), copper (Cu), Zinc (Zn), and aluminum (Al) were detected using I.C.P Spectrophotometer, (Inductively Coupled Argon plasma, iCAP 6500 Duo, Thermo Scientific, England), using 1000 ppm (Merck) stock solution for standard preparation.
Experimental evaluation of scaling formation tendency
To evaluate the influence of feed water salinity on Scale Morphology, three different samples of feed water were tested in 75 mL glass test tubes with different water recovery percentages 30, 60, and 90 % at 90 °C. Test tubes were scrubbed and rinsed using concentrated hydrochloric acid, and then they were thoroughly washed with purified water, then the inside wall of test tubes was coated with aluminum sheets for observing the precipitate formation. Each of the feed water samples was carefully transferred to individual 75 mL glass tubes.
The tubes were then placed into their respective water baths operating at 90 °C. The temperatures of the water baths were monitored routinely using thermometers and were kept constant by a thermostat.
The tube was recharged immediately with feed water at the same time of water evaporation using a graduated burette.
The precipitates formed in aluminum surfaces of feed water samples were observed individually for every recovery percentage using optical microscope.
Results and discussion
Groundwater salinity distribution
Total dissolved solids (TDS) comprise inorganic salts that are dissolved in water. According to the total dissolved solids (TDS) of the investigated groundwater samples, the groundwater salinity shows that the TDS values of El Qaa plain groundwater vary from 394 ppm (sample No. 12) to 4907 ppm (sample No.19) reflecting fresh to brackish category, while El Gebail groundwater has brackish water to highly saline as it varies from 2578 ppm (sample No. 11) to 13864 ppm (sample No. 5). It is clear that 42 % are brackish (Nos. 3, 7, 11, 22, and 24) and 42 % are saline (Nos. 1, 2, 6, 8, and 9), while 16 % of samples are highly saline (Nos. 5 & 10). The salinity distributions in the study area are shown in (Fig. 6). It was found that the groundwater salinity in El Qaa area increased from Northeast to Southwest and from North to South in El Gebail area. This variation of salinity indicates different direct flows (seepage) of surface and subsurface water, which may be attributed to the location of wells near or away from the rainfall recharge area. The groundwater salinity is influenced by climate factors, groundwater level, and seawater intrusion.

Iso-salinity contour map for the groundwater in study area
Chemical water types
According to chemical analyses of groundwater samples, the water chemical types are classified according to the dominant anions and cations into:
-
Chloride–Sodium; characterizing 95 % of samples.
-
Chloride–Calcium; characterizing one sample (No. 23).
According to the ion dominance, Chloride–Sodium chemical water type is recognized in El Gebail area. It is the dominant water type characterizing the saline groundwater in El Gebail area. Presence of Chloride–Sodium type reflects the advanced stage of groundwater metasomatism. Such type reflects the leaching and dissolution of marine salts.
Assemblages of hypothetical salts
Hypothetically, the ions of the strong acids (Cl− and SO4 2−) form chemical combination with alkalis (Na+ and K+) and the rest of the acid radicals combine with the alkaline earths (Ca2+ and Mg2+). If the cations of alkalis and alkaline earths are surplus in water, they well combine with the weak acids (CO3 2− and HCO3 −). To clarify such combinations, the relationships between cations and anions in the investigated waters are illustrated in the form of bar graphs.
The combination of major anions and cations in the investigated groundwater of El Gebail reveals the formation of one group of hypothetical salts (Fig. 7a).

Bar graph for representative groundwater samples a El Gebail area and b El Qaa plain
All groundwater at El Gebail area are characterized by assemblage (NaCl, MgCl2, CaCl2, CaSO4, and Ca (HCO3)2), which has three chloride salts (more advanced stage) of chemical development reflecting leaching and dissolution of terrestrial and marine salts. On the other hand, the combination of major anions and cations reveals the formation of three main groups of hypothetical salts in El Qaa plain groundwater (Fig. 7b). These salts are:
-
I.
NaCl, Na2SO4, MgSO4, CaSO4, and Ca (HCO3)2.
-
II.
NaCl, MgCl2, MgSO4, CaSO4, and Ca (HCO3)2.
-
III.
NaCl, MgCl2, CaCl2, CaSO4, and Ca (HCO3)2.
The results reveal that (60 %) of Groundwater samples in El Qaa are characterized by assemblages II and III, (more advanced stage of chemical development), and (40 %) are characterized by assemblage I (less advanced stage of chemical development), where the presence of Na2SO4 reflects the impact of terrestrial salts dissolution.
Scale prediction modeling
Referring to the evaluation of water characteristics in study area, water samples in El Gebail which have excess salts are estimated as feed water for solar thermal desalination. Two computer programs were applied to achieve the main target:
-
NETPATH for windows.
-
PHREEQC.
Chemical equilibrium and saturation indices (SI)
The saturation indices (SI) of the major mineral phases in the investigated water samples were calculated using the software package (NETPATH-WIN). The obtained results, (Figs. 8, 9, 10, 11) reflect that

Saturation indices with respect to carbonate minerals in El Gebail area samples

Saturation indices with respect to sulfate minerals in El Gebail area samples

Saturation indices with respect to silicate minerals in El Gebail area samples

Saturation indices with respect to iron minerals in El Gebail area samples
-
1.
The groundwater samples (Nos. 2, 3, 11, 22) have negative (calcite, aragonite, and dolomite) indices, while sample (No. 5) has negative dolomite, as well as the rest of groundwater samples are supersaturated with respect to the main carbonate minerals (calcite, aragonite, and dolomite).
-
2.
Most of the groundwater samples have negative gypsum indices, indicating that, (the most of groundwater samples are unsaturated with this mineral). The dissolution of gypsum can be expressed as follows:
$${\text{CaSO}}_{ 4} \leftrightarrow {\text{ Ca}}^{ 2+ } + {\text{ SO}}_{ 4}^{ 2- }$$ -
3.
Increasing of Ca2+ concentration due to gypsum dissolution causes calcite to precipitate. However, the dissolution of gypsum induces the transformation of dolomite to calcite in the sediments and produces water with high Mg2+, Ca2+, and SO4 2− concentrations (Appelo and Postma 2005).
-
4.
Most of the groundwater samples are saturated with respect to quartz, chalcedony, and talc.
-
5.
The groundwater is supersaturated with respect to iron mineral phases (hematite, goethite). Hematite and goethite reflect the sensitivity of iron to oxidation even in low concentrations.
Corrosivity and scale formation
According to the saturation indices of minerals in the investigated water samples as indicator of water corrosivity or scale forming, the following could be deduced:
-
1.
About 31 % of water samples are faint coating, (Fig. 12). Faint coating in the municipal wells may (by time) lead to clogging of the pipes, which transport the water to the inhabitants, so treatment is recommended.
Fig. 12 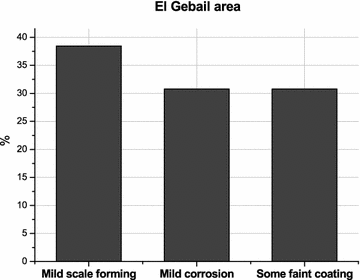
The representation of the water samples in El Gebail area based on its tendency to be corrosive
-
2.
About 38 % of samples are mild scale forming.
-
3.
About 31 % of water samples are mild corrosion.

Using PHREEQC Model
PHREEQC was used for applying evaporation with continuous water feeding model to simulate perspectives of solar-powered desalination unit (Fig. 1). For applying the model, the data of water chemical analyses of wells, Nos. 1, 2, 3, 4, 5, 8, and 10, are used in this study. Model was applied at 90 °C using different water recovery percentages from feed water, the first is 30 %, the second is 60 %, and the third is 90 %; the results are shown in (Figs. 13, 14, 15, 16, 17, 18, 19, 20, 21, 22, 23). From the results of PHREEQC, we can make a comparison between the saturation indices of minerals in the investigated water samples and the results as indicator of water corrosivity or scale forming, The obtained results, (Fig. 23) reflect that the scaling tendency of the desalination unit increases as water recovery percentage increases from feed water by increasing ions concentration responsible to form scale Ca2+, SO4 2−, and HCO3 −. This threat of scaling is more serious when the temperature increases; indeed, these two salts, CaCO3 and CaSO4, present, particularly, have an inverse solubility phenomenon. Also results indicate that water recovery percentages of 60 and 90 % with continuous water feeding are suitable for operation in desalination systems.

The simulated outlet results of PHREEQC for saturation indices of aragonite mineral

The simulated outlet results of PHREEQC for saturation indices of dolomite mineral

The simulated outlet results of PHREEQC for saturation indices of anhydrite mineral

The simulated outlet results of PHREEQC for saturation indices of celestial mineral

The simulated outlet results of PHREEQC for saturation indices of chalcedony mineral

The simulated outlet results of PHREEQC for saturation indices of quartz mineral

The simulated outlet results of PHREEQC for saturation indices of talc mineral

The simulated outlet results of PHREEQC for saturation indices of hematite mineral

The simulated outlet results of PHREEQC for saturation indices of goethite mineral

The simulated outlet results of PHREEQC for saturation indices of siderite mineral

The simulated outlet results of PHREEQC for saturation indices a calcite mineral and b gypsum mineral
Influence of feed water salinity on Scale Morphology
Three different feed waters (wells Nos. 1 and 8) and sea waters (No. 4) were tested with different water recovery percentages at 90 °C. Figure 24 shows the morphology micrograph of the precipitate. It can be observed that, as the water salinity increased, the structure of the precipitate changed. This does not mean that the morphology changed, but it means that the structure of the composite precipitate changed. For well No. 1, the precipitate was found to be attached to the test tube wall, with many crystals. Precipitates for well No. 8 have a structure contained more small needle-shaped crystals, it is clear from the figure that precipitate was found to adhere to the test tube wall. Precipitates for sea water No. 4 had a structure very different from those of the previous precipitates and consisted mainly of very fine powdery crystals. This precipitate was found to adhere to the test tube wall in a fine even layer.

Micrograph showing the scale formed on the heat transfer surface a water sample 1 at different water recovery percentages b water sample 8 at different water recovery percentages c water sample 4 at different water recovery percentages
Conclusions
Evaluating and mapping feed water for solar thermal desalination plants indicate that water samples in El Gebail have excess salts for major wells and cannot be used for drinking without desalination. Also the water samples have a significant amount of calcium sulphate and small amount of calcium carbonate. Using PHREEQC to simulate feed water evaporation with continuous water feeding allows quantification of changes in solution composition during pure water recovery and allows simulation of the effects of these changes on precipitation of subsequent scale-forming solids. The resulting simulated saturation indices values could be used to quantitatively assess the potential of a given feed water to form scale or to compare the possibility of a number of feed waters to form scale during solar desalination. Simulated model of feed waters cannot perfectly predict the surroundings under which scale will form due to the effects of potentially stable supersaturated solutions, solution velocity, and residence time inside the mix tank of the desalination systems. However, the simulated scale-forming potential of planned feed waters could be compared with the actual scale-forming properties of feed waters, as operational histories in desalination systems are already known. This may provide a technique to estimate the actual performance of proposed feed waters under optimum set of conditions. The experimental data could validate the technique described in this study as a regular method for assessing the suitability of intended feed waters for solar thermal desalination. The tests carried out to assess the effect of water salinity on scale formation morphology confirm that nucleation and crystalline growth increase with increase in the percentage of pure water recovery.
In view of the present study, to overcome both high groundwater salinity and water shortage in the investigated area, the following steps are recommended:
Periodical chemical analyses must be carried out to monitor water quality changes.
Construction of solar thermal desalination using solar collectors with heat exchanger in closed cycle to reduce the economical cost.
Use Solar distillation basin integrated with thermal desalination units before feeding water to heat exchanger and pass air through water in the basin, which may enhance precipitation and reduce scaling without using chemicals.
References
Appelo, C. A. J., & Postma, D. (2005). Geochemistry, Groundwater and Pollution (2nd ed.). Rotterdam: Balkema.
Diabate, L., Blanc, P., & Wald, L. (2004). Solar radiation climate. Africa., 76, 733–744.
Elewa, H. H., & Qaddah, A. A. (2011). Groundwater potentiality mapping in the Sinai Peninsula, Egypt, using remote sensing and GIS-watershed-based modeling. Hydrogeology Journal, 19(3), 613–628.
El-Kadi, A. I., et al. (2010). NETPATH-WIN: An Interactive User Version of the Mass-Balance Model, NETPATH. Department of Geology and Geophysics and Water Resources Research Center, University of Hawaii at Manoa, Honolulu, Hawaii, 96822(808), 956–6331.
El-Sadek, A. (2010). Water desalination: An imperative measure for water security in Egypt. Desalination, 250(3), 876–884.
Ferguson, R.J. (2002). PREDICTING CALCIUM OXALATE SCALE. French Creek Software, Inc. In: CORROSION 2002. NACE International, Denver, CO, USA. (02), pp.1–9
Ferguson, R.J. (2011). Mineral Scale Prediction and Control at Extreme TDS. French Creek Software, Inc. In: International Water Conference. ESWP, Orlando, FL, USA,, p.77.
Fishman, M.J. & Friedman, L.C. (1985). Methods for determination of inorganic substances in water and fluvial sediments. U.S. Geol. Surv., Book 5, Chapter A1. Open File Report, Denver, Colorado, U.S.A., pp.85–495.
Huber, P., Burnet, A., & Petit-Conil, M. (2014). Scale deposits in kraft pulp bleach plants with reduced water consumption: A review. Journal of Environmental Management, 141C, 36–50.
Huff, G. F. (2004). Use of simulated evaporation to assess the potential for scale formation during reverse osmosis desalination., 160, 285–292.
Koukkari, P., Penttilä, K., Hack, K. & Petersen, S., 2000. CHEMSHEET – An Efficient Worksheet Tool for Thermodynamic Process Simulation. Microstructures Mechanical Properties and Processes, 3, pp.323–330.
Parkhurst, B.D.L. & Appelo, C.A J.(1999). User’s Guide To PHREEQ-C (version 2)—a Computer Program for Speciation, and Inverse Geochemical Calculations. ExchangeQuery Organizational Behavior Teaching Journal, D(Version 2), p.326.
Rahman, F. & Amjad, Z., 2009. Formation and Control in 14 Scale Thermal Desalination Systems., pp.271–297.
Rainwater, F.H. & Thatcher, L.L. (1960). Methods for collection and analysis of water samples. U.S. Geol. Survey. Water Supply. Paper No. 1454, U.S.A., 301p.
Sharon, H., & Reddy, K. S. (2015). A review of solar energy driven desalination technologies. Renewable and Sustainable Energy Reviews, 41, 1080–1118.
Shatat, M., Worall, M., & Riffat, S. (2013). Economic study for an affordable small scale solar water desalination system in remote and semi-arid region. Renewable and Sustainable Energy Reviews, 25, 543–551.
Thompson, J., et al. (2013). Rapid field assessment of RO desalination of brackish agricultural drainage water. Water Research, 47(8), 2649–2660.
Vidojkovic, S., et al. (2013). Extensive feedwater quality control and monitoring concept for preventing chemistry-related failures of boiler tubes in a subcritical thermal power plant. Applied Thermal Engineering, 59(1–2), 683–694.
Villaf, A. (2005). Prediction of mineral scale formation in geothermal and oilfield operations using the extended UNIQUAC model Part I. Sulfate scaling minerals., 34, 61–97.
Wang, P. (2010). Modeling chemical and phase equilibria in geochemical systems using a speciation-based model. Journal of Geochemical Exploration, 106, 219.
W.U., C.E.G., G.S.E., Dept. (2002). Corrosion, saturation index, balanced water in drinking water systems-Source and cause of corrosion. Wilkes University-Center of Environmental QualityGeo environmental Sciences and Engineering Department.
Authors’ contributions
AA was the principal investigator and edited the manuscript. SAM carried out the water chemical analyses and their interpretation. SEM, EAG and MF drafted the manuscript. All authors read and approved the final manuscript.
Acknowledgements
The authors are grateful to late Dr. Adel Abd Elaleam Hammouda from Desert Research Center, Cairo, Egypt for guidance and assistance. We also appreciate the suggestions, comments, and constructive criticisms of two anonymous referees who contributed much to the improvement of an earlier version of this manuscript.
Competing interests
The authors declare that they have no competing interests.
Author information
Authors and Affiliations
Corresponding author
Rights and permissions
Open Access This article is distributed under the terms of the Creative Commons Attribution 4.0 International License (http://creativecommons.org/licenses/by/4.0/), which permits unrestricted use, distribution, and reproduction in any medium, provided you give appropriate credit to the original author(s) and the source, provide a link to the Creative Commons license, and indicate if changes were made.
About this article

Cite this article
Mohallel, S.A., Metwally, S.E., Gomaa, E.A. et al. Assessment of scaling formation during solar desalination using PHREEQC modeling in El Gebail and El Qaa plain areas: southwest Sinai. Renewables 3, 4 (2016). https://doi.org/10.1186/s40807-016-0024-6
Received:
Accepted:
Published:
DOI: https://doi.org/10.1186/s40807-016-0024-6