- Research
- Open access
- Published:
Electricity mix from renewable energies can avoid further fragmentation of African rivers
Sustainable Energy Research volume 11, Article number: 15 (2024)
Abstract
In Africa, mitigating climate change in a context of a growing human population and developing economies requires a bold transition to renewable energy (RE) resources. Declining costs for solar photovoltaics (by 90% between 2009 and 2023) and wind turbines (by 57% between 2010 and 2023) fuelled their construction, and hybrid forms such as floating photovoltaics (FPV) on existing hydropower reservoirs are increasingly being explored. Nevertheless, 65% of the proposed RE capacity in Africa remains hydropower, despite confirmed ecological, socioeconomic, and political ramifications on different spatiotemporal scales. The 673 proposed hydropower plants (HPPs) would increasingly affect river systems and threaten their biodiversity. While there is clear evidence that a transition to RE in Africa is technically feasible, there is a lack of spatially explicit studies on how this transition could be implemented. Hence, the aim of the present study is to explore options for an RE mix that avoids additional hydropower construction and, therefore, further river fragmentation. Attribute data of the open-accessible Renewable Power Plant Database (RePP Africa) were analysed to assess the amount of lost capacity due to operation stops. Geospatial analyses of solar irradiation and existing reservoir data were used to derive the potential for FPV. The degree of possible replacement of future hydropower was assessed under consideration of economically feasible wind and solar photovoltaic (PV) potential. To enhance electricity generation from existing HPPs, efficient and sustainable renewable power plant planning must integrate the risk of failure, as it has diminished the available capacity in the past up to 24%. Our findings further reveal that 25 African countries could replace the proposed hydropower development by FPV covering less than 25% of the surface area of their existing hydropower reservoirs. All 36 African countries could replace proposed hydroelectricity generation by fully exploiting feasible onshore wind and solar PV potential with a mean surplus of 371 TWh per year. In summary, our findings provide scientific evidence to support policy discussions on the potential electricity gains from (1) minimizing plant failure, (2) installing FPV as a co-use option, and (3) exploiting wind and solar resources. This study provides quantitative, data-based, and spatially explicit scenarios on the implementation of an RE mix that could relieve the dam building pressure on African rivers.
Introduction
Human population growth and growing economies require a major expansion of power capacities across Africa (increase in average gross domestic product (GDP) of + 4% in 2023 and 2024, respectively) (AfDB, 2023). Concurrently, climate change mitigation urges a shift to renewable energy (RE) resources, accompanied by the goal to “ensure access to affordable, reliable, sustainable, and modern energy for all” [Sustainable Development Goal (SDG) 7 (UN, 2015)] for almost half of the African population that currently lacks access to electricity. At continental level, hydropower accounts for 77% of the total electricity production from renewables across Africa (156 of 202 TWh, 2021) (IEA, 2023). There is clear evidence that hydropower plants (HPPs) operating with a dam and reservoir storage can cause ecological, socioeconomic, and political ramifications on different spatiotemporal scales (Botelho et al., 2017). However, decisions on future dam locations are commonly driven by political constraints and engineering assessments (Wang et al., 2021).
Environmental Impact Assessments (EIA) are a policy instrument to ensure that the environmental implications of a project are anticipated and minimised (Botelho et al., 2017). Indeed, in many countries, EIAs are legally binding; however, in emerging economies, the implementation of EIAs can barely keep pace with the development of new hydropower projects (e. g. India; Erlewein, 2013). In addition, a major shortcoming of EIAs is the spatial level they cover: EIAs assess HPPs on a project level rather than on a catchment, national or international scale. This is in particular problematic for HPPs operating with a dam and reservoir because they may alter the flow, sediment and thermal regime of entire river networks, thereby causing basin-wide impacts.
In contrast to EIAs, Strategic Environmental Assessments (SEAs) are implemented at an earlier stage of project development to identify potential negative impacts of a proposed policy, program, or plan and to inform its development. Thereof, SEAs use a range of analytical and participatory approaches. SEAs are commonly commissioned by financing institutions. In contrast to EIAs, SEAs explicitly focus on a project’s inter-linkages with economic and social considerations. Despite its integrative design, real-life examples have outlined the shortcoming of SEAs: a review on the SEA for the Julius Nyerere HPP being constructed in the Selous Game Reserve, a UNESCO World Heritage site at Rufiji River in Tanzania, found that the assessment did neither consider cumulative impacts nor the full range of economic, environmental and social benefits and costs (IUCN, 2019). As such, the praxis of both, EIAs and SEAs, is not capable to guarantee that HPP impacts on river systems are fully anticipated and assessed.
In Africa, proposed HPPs and other dam-related infrastructure increasingly impact entire river systems and their unique biodiversity (Opperman et al., 2022). According to the Renewable Power Plant Database Africa (RePP Africa), 243 HPPs are proposed to operate with reservoir storage and dam. No information is available on the type of a further 281 proposed HPPs. In total, the proposed hydropower dams would double the present number of hydropower dams (Peters et al., 2023). Moreover, if all proposed HPPs were implemented 75% of the African river volume would be moderately to severely altered (Fig. 1b). This is a conservative estimate, because many additional dams and reservoirs are built and used for irrigation, water supply, flood control, fisheries, and other purposes (Lehner, Liermann, et al., 2011). According to the Global Reservoir and Dam Database (GRanD), a total of 693 dams with other purpose than hydropower fragment African rivers, with 400 mainly intended for irrigation, 135 for water supply, four for flood control and one for recreational purposes (Lehner, Liermann, et al., 2011). For 147 reservoirs and dams, the purpose is not specified (Lehner, Liermann, et al., 2011).

a Existing and proposed hydropower capacity [MW] in comparison (b) to river fragmentation per sub-basin from existing and proposed dams [%]. a. Circles indicate proposed (orange) and existing (white) hydropower plants (HPPs). The category “Existing HPP” includes HPPs under construction. Countries are coloured according to the total capacity in megawatt [MW]. Colour intensity increases with capacity. b. Circles indicate proposed HPPs (orange) and existing dams of hydropower and other purposes (white). Sub-basins are coloured according to their quartile value (Q) in percent (%). Colour intensity increases with river fragmentation index (RFI). Data: a: RePP Africa (Peters et al., 2023); b: GRanD (Lehner, Liermann, et al., 2011), River discharge (Meng et al., 2020)
The proposed hydropower dams would further increase river fragmentation of large river basins such as the Nile [River fragmentation index (RFI) of 90%, calculated according to a methodology from Grill et al. (2015)], Zambezi (RFI 87%), and Niger (RFI 90%). However, the riparian countries most affected are not always the countries that benefit most from the additionally generated hydroelectricity (Fig. 1). If the negative impacts outweigh the hydroelectricity benefits, or if a country does not benefit at all, conflicts are likely to arise between riparian countries. Globally, under a business-as-usual scenario, 920 million people are projected to live in very high to high conflict-risk basins by 2050, with exacerbating risks in river basins of the Sahel, the Horn of Africa and parts of southern Africa (de Bruin et al., 2023). Long-term cooperation among riparian countries is needed, but also an optimisation of existing HPPs and a careful large-scale assessment before building additional hydropower dams (Opperman et al., 2023).
Acknowledging the need for renewable electricity but also aimig to minimize the degree of projected river fragmentation, investigation of possible alternatives and optimisation of existing HPPs are possible pathways to relieve the overall pressure on rivers and reach a more sustainable renewable energy transition.
An optimised exploitation of installed hydroelectricity needs to assure that existing HPPs operate on their full potential. Few studies investigated how much electricity is generated by existing HPPs and which factors cause differences between effectively generated and nominal capacity. Wan et al., (2021) studied, on a global level, to which degree hydrological variability and number of operating plants have reduced generated capacity in the past; however, results for the African continent were unsatisfactory. Hence, we need to better assess the risk of plant failure in HPP operation and planning, which again requires evidence on how HPPs have performed in the past considering times of reduced capacity production and failure.
Addressing the search for alternatives, wind and solar power have been increasingly developed, concurrently driven by a high availability of both resources across the continent and a continuous drop in production costs. However, in contrast to hydropower, both wind and solar are variable renewable resources with daily shifts in availability. To guarantee a stable electricity outcome, storage capacity (e.g. from batteries or a dam with a reservoir) is needed. Thereof, matching supply and demand in renewable electricity systems using smart management technologies can improve the use of existing (hydropower and battery) storage capacities while reducing the need for additional storage options (Balasubramanian & Balachandra, 2021; Sterl et al., 2020).
In addition to the challenge of integrating variable power capacity from solar and wind resources into renewable-based electricity systems, the implementation of wind farms and solar parks requires space and can evoke land-use conflicts. Other reported impacts of onshore wind power include increased habitat loss and animal mortality (Hamed & Alshare, 2022; Loss et al., 2019; Millon et al., 2018; Popescu et al., 2020); noise pollution (van Kamp & van den Berg, 2018); and perception of visual impact (McKenna et al., 2021; Peri & Tal, 2021). The impact associated to solar power infrastructure varies with technology type (rooftop, standalone or floating PV; concentrated solar panels). It is reported that large solar facilities alter a landscape and impact visual perception, biodiversity, and microclimate (Hamed & Alshare, 2022; Torres-Sibille et al., 2009). Impacts of floating PV on a reservoir increase with the area covered and can cause algal blooms, reduce oxygen production (through shading), but remain poorly studied (Almeida et al., 2022a, 2022b).
Hybrid plants are a trending option that exploit the complementary spatiotemporal properties of RE resources at one location. A combination of variable power from solar (SPPs) and wind power plants (WPPs) with storage capacity from existing HPPs is increasingly explored to reduce the need for new energy storage and grid infrastructure (Shivarama Krishna & Sathish Kumar, 2015). One example is the co-use of a hydropower reservoir via floating photovoltaics (FPVs) (Almeida et al., 2022a, 2022b; Gonzalez Sanchez et al., 2021), which also prevents water loss from evaporation (Ates et al., 2020). This combined setup works on average 11% more efficiently than ground-mounted solar panels due to the cooling effect of the underlying water (Sahu et al., 2016). Furthermore, no additional land area is required which is of particular interest because a solar PV plant installed on-ground occupies 19 m2 per megawatt hour (MWh) while hydropower needs 14 m2 per MWh and a nuclear plant only 0.3 m2 per MWh (Ritchie, 2022).
Optimisation and co-use of existing HPPs offer opportunities to rethink the proposed HPP infrastructure. During the past decade, the declining costs for solar PV [90% decline since 2009 (IRENA, 2022b)] and wind turbines [55–60% decline since 2010 (IRENA, 2022b)] have led to increasing growth rates for SPPs and WPPs. Remaining renewable potential of > 99% for both solar and wind power supports the assumption that many African countries could skip a phase of high fossil fuel dependency and transit directly to renewable-based electricity systems (Peters et al., 2024).
To match the growing electricity demand with RE and build sustainable electricity systems, we hypothesise that aligning existing renewable power plants with the exploitation of non-hydro-alternatives can optimise the RE system and reduce the pressure on (functioning) river systems. However, there is a lack of spatially explicit and integrated studies on how this transition could be implemented. Thus, the aims of this study were to estimate the potential of (1) minimizing plant failure and thus increasing the renewable electricity generation by maintaining and improving existing infrastructure, (2) co-using existing (hydropower) reservoirs by complementing them with FPV, and (3) replacing proposed HPPs with potential solar PV and onshore wind power sites. This study provides quantitative, data-based and spatially explicit insights on the status and projections for the implementation of a renewable energy mix that could relieve the dam building pressure on rivers in Africa.
Materials and methods
To answer the posed research questions, the analytical procedure includes three steps (Fig. 2). Each analysis uses spatially explicit data on HPPs compiled from the RePP Africa database; Analyses 2 and 3 further use data from the Global Solar Atlas (WB, 2023) and the modelled supply regions for solar photovoltaic and onshore wind, respectively (Sterl et al., 2022). While Analysis 1 implements an in-depth analysis of RePP Africa attributes on historical operating times, Analyses 2 and 3 use geospatial methods to analyse the different datasets.

Methodological approach. The Renewable Power Plant Database (RePP Africa) forms the data basis for the three analyses. Red circles indicate which hydropower plant operating types are included in a certain analysis. 1. The maintenance potential compares the cumulated capacity of hydropower plants without (theoretical) and with (realistic) operation stops. 2. The co-use potential assesses how much capacity could be generated by installing floating photovoltaics (FPVs) on existing reservoirs. The analysis includes data of the Global Solar Atlas (Solar atlas). 3. The replacement potential assesses how much proposed hydropower capacity would be replaced if onshore wind and solar photovoltaic were fully exploited. This analysis includes the modelled energy supply regions (MSR) which are technically and economically feasible areas for onshore wind or solar photovoltaic exploitation
Data
For this study, data on existing and proposed HPPs were combined with areas that have been selected as potential best candidates for solar and wind electricity generation. Both datasets cover all 54 African countries including island states. HPP data were used from RePP Africa, a georeferenced database on existing and proposed hydro-, wind, and solar power plants (Fig. 2) (Peters et al., 2023). It includes information on capacity [MW] and operational type. For the latter, it distinguishes between reservoir, pumped storage, run-of-river, and unknown. RePP Africa also lists—if information is available—the year of first operation start, full operation start and operation stop if applicable. We used data on modelled energy supply regions to assess the economically feasible wind and solar power potential for the entire continent (Sterl et al., 2022). The regions include all areas where solar irradiation or wind speed, respectively, are sufficient for commercial exploitation, but exclude areas of high human population, high elevation, steep slope, certain categories of land use (e.g. forest areas, floodplains), protected areas, and areas with large distance from an existing road network.
The selected sites were ranked according to their respective levelised cost of electricity and only the highest ranked included in the dataset. The total area sum was calculated and compared to the individual country’s surface area. If the total area sum exceeded 5% of the individual country’s surface area, lower ranked areas were excluded. Among all African countries, 39 countries have data on 355 existing HPPs, 23 countries on 46 HPPs under construction, and 40 countries on 673 proposed HPPs. 43 countries were assessed to have feasible wind potential, and 49 to have feasible solar PV potential. In this study, the Sahrawi Arab Democratic Republic (Western Sahara) is geographically aggregated with Morocco due to technical reasons. No statements on the political situation are intended.
If available and suitable, reservoir data of the Global Reservoir and Dam Database (GRanD) were used for FPV area estimates instead of digitalizing the reservoir manually (Lehner, Liermann, et al., 2011). In order to assess the FPV potential annual average data on the global tilted irradiation of the Global Solar Atlas were used (WB, 2023). The global radiation at an optimum tilt refers to total radiation received on a surface with defined tilt and azimuth and is provided with a spatial resolution of 9 arcsec (nominally 250 m). The long-term yearly average of daily totals is calculated from time-series data of global horizontal irradiation, direct normal irradiation, and terrain horizon. The Global Solar Atlas was developed by Solargis under the funding of The World Bank Group (ESMAP, 2020).
Potential for electricity generation by reducing hydropower plant failure (maintenance potential)
We used RePP Africa attribute data on historic plant failure to analyse the amount of historic capacity reduction from hydropower operating stops (Peters et al., 2023). Times of reduced operation or complete stop were used as an indicator of having reduced the exploitation of the installed capacity in the past. HPPs of all types were included in this analysis to assure the largest possible sample size (Fig. 2). Time and respective “loss” in generated electricity due to technical plant failure was calculated from 1903 to 2020. This includes information on the year of operational start, the year of operational start on full capacity, the year of operational stop, and information on current operational status (operational/not operational, census: 2022). Of the included 355 existing HPPs, 29 are not operating. For 350 HPPs, the year of operation start, for 53, the year of operating start on full capacity, and for 25, the year of operation stop is indicated. For the years prior to full capacity operation, the full installed capacity was reduced to 50% because, according to RePP Africa, many HPPs start operating with half of their turbines running (Peters et al., 2023). Actual electricity generation was then compared to a potential electricity generation assuming that HPPs were operating at full capacity.
Potential for electricity generation by complementing existing hydropower reservoirs with floating photovoltaics (co-use potential)
To calculate the electricity that could possibly be produced by adding FPV to existing hydropower reservoirs, we compiled a dataset with the area information (geometry and size) of reservoirs that corresponds to the dam data points of RePP Africa (Peters et al., 2023). Therefore, all reservoir polygons from the GRanD database were selected that matched satellite images of Google Earth Pro version 7.3.6.9345 (Google Earth, 2023). All other reservoirs (not matching satellite images or not available in GRanD) were manually digitalised in Google Earth Pro. Of the 355 HPPs listed in RePP Africa, 129 HPPs classified as run-of-river plants were excluded. The 226 remaining HPPs operate either with a reservoir (type reservoir and pumped storage) or the type is unknown (Fig. 2). Of these 226 HPPs, 190 reservoirs spread over 35 countries were included in the analysis and further processed in ArcGIS Pro (ESRI, 2022). Among those, for five HPPs of type pumped storage, two reservoirs were digitalised. Data exclusion had the following, different motivations: cases with conflicting information were excluded for further analysis, i.e. 13 HPPs had a different operating type than indicated in RePP Africa (run-of-river instead of reservoir or unknown). For 20 HPPs, reservoir digitalisation was impossible, because no reservoir was found on Google Earth satellite images. From RePP Africa, seven data entries were excluded since they represent capacity updates to an existing reservoir. One power plant was excluded as it appeared twice in RePP Africa. We calculated the potential annual electricity production for FPV on existing reservoirs as follows:
where EPFPV is the annual electricity production [MWh], ARes the total reservoir area [m2], rA the ratio of reservoir area covered by FPV (AFPV/ARes with AFPV being the total reservoir area covered by FPV [m2]), and GTI the annual total of global tilted irradiation for the respective reservoir [kWh/m2]; 1000 is a conversion factor from kWh to MWh. The global tilted irradiation is the maximum amount of solar radiation that can be received at the ground at the optimum angle (WB, 2023). Projected polygons of reservoir areas were converted taking the polygon centre of the reservoir as a point. In a next step, the corresponding value of the global tilted irradiation (GTI) was extracted at this location [resolution: 9 arcsec (nominally 250 m)]. A medium coverage of rA = 40% was chosen to assess the area that could potentially be covered with FPV. We selected a 40% coverage, because the literature suggests that up to a coverage of 40% effects on algal bloom and organisms remain negligible or small (Pouran et al., 2022; T. Wang et al., 2022). We calculated the potential for replacing proposed hydropower capacity by exploiting FPV on existing HPP reservoirs as
where Replacement < 0 means that the exploitation of FPV could not cover the proposed hydroelectricity, and Replacement > 0 that the full FPV potential would exceed the generated annual electricity from proposed HPPs.
There is lack of scientific consensus on the degree of coverage that is suitable for FPV generation while maintaining the reservoirs biogeochemical and ecological balance. Thus, sensitivity was tested by running two additional scenarios with a capacity of 20 and 60%. Results were compared to the scenario with a 40% coverage. In addition, results were compared to a scenario where 40% of non-hydropower plants on the African continent are covered with FPV. The analysis was run for 640 reservoirs from the GRanD database, which have hydropower neither as major nor as secondary purpose (Lehner, Reidy Liermann, et al., 2011).
In addition, we assessed for all countries with Replacement > 0 the minimum share of reservoir area [%] that would need to be covered with FPV to replace the electricity from proposed hydropower capacity.
Potential for electricity generation by solar and wind power replacing proposed hydropower plants (replacement potential)
The potential wind and solar electricity in gigawatt hours (GWh) given for the modelled electricity supply regions were cumulated for each country (Sterl et al., 2022). The modelled electricity supply regions are areas that are technically and economically feasible for onshore wind or solar PV exploitation. The identification of these regions includes the assessment of feasible areas based on a set of different indicators (solar irradiation or wind speed, human population, elevation, slope, forest, protected areas, distance to existing road network). All areas are ranked according to their respective levelised cost of electricity and only the highest ranked areas included. In that regard, the total surface area of the included areas does not exceed 5% of the individual country’s surface area.
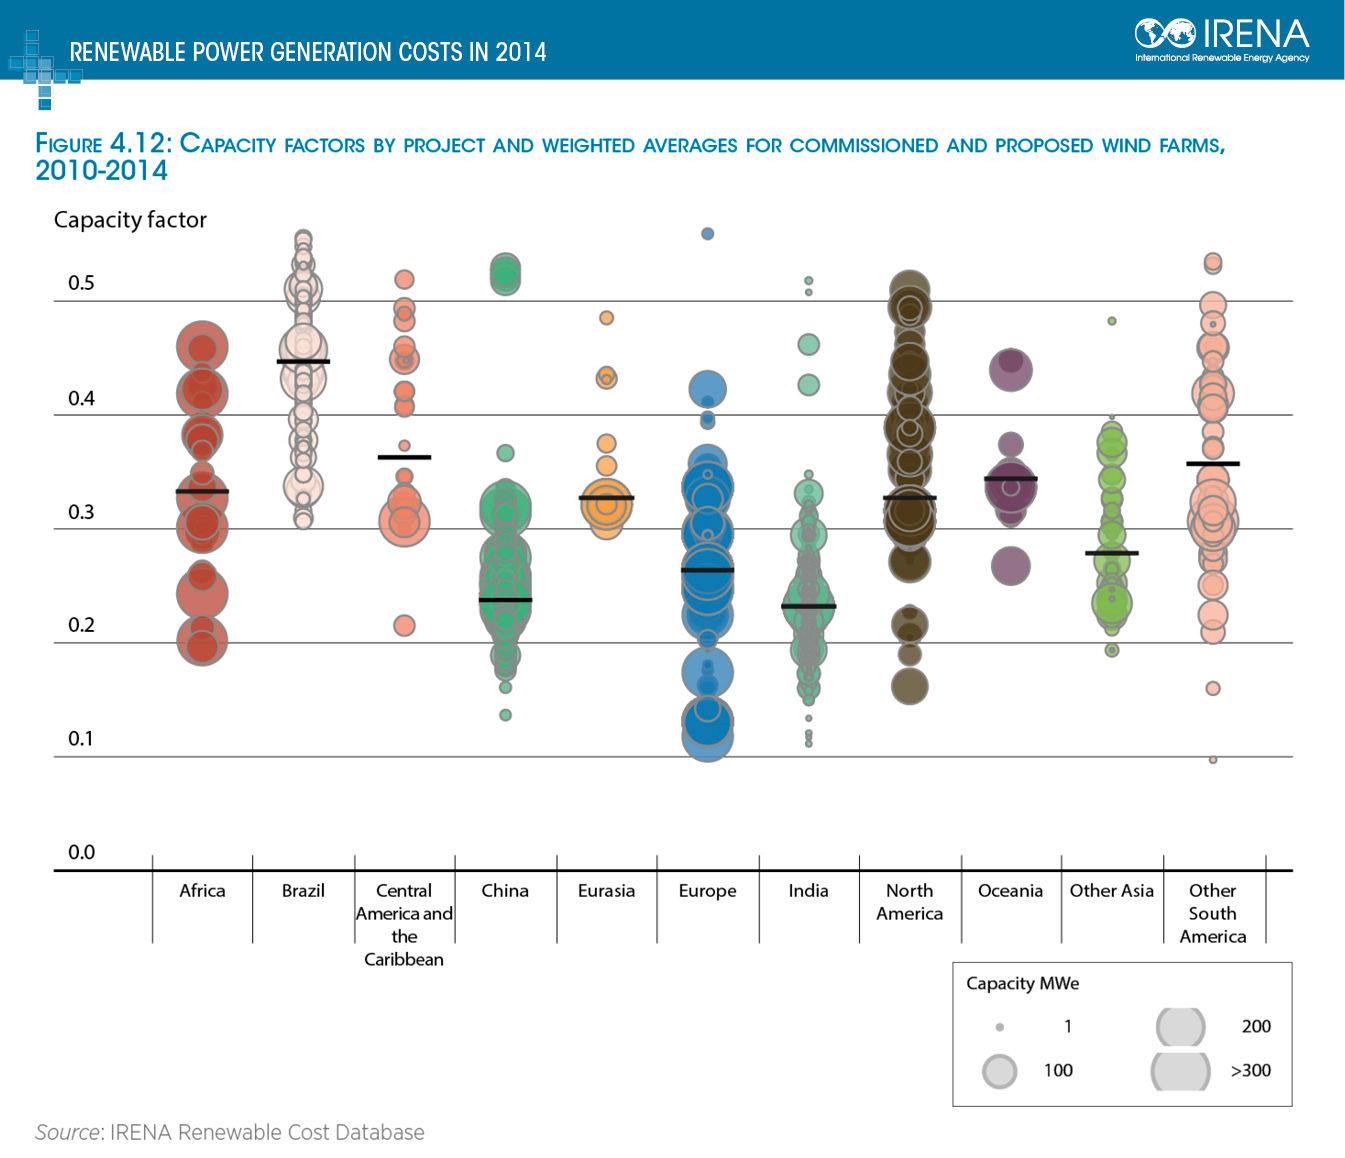
In order to estimate the overall annual electricity generation of proposed HPPs, the capacity values [MW] of 524 proposed HPPs with the operating type “reservoir” or “unknown” were summed up by country (Fig. 2). HPPs of these types are proposed in 37 African countries. Sao Tome and Principe was excluded, because the dataset on modelled supply regions does not cover the island state (Sterl et al., 2022). An average capacity factor of 55% was applied to estimate the total electricity [GWh] generated per country (IRENA, 2022a).
The annual replacement potential [GWh] was calculated as
where Replacement < 0 means that the exploitation of solar and wind potential could not cover the proposed hydroelectricity, and Replacement > 0 that the full exploitation of solar and wind potential would exceed the generated electricity from proposed HPPs.
For all countries with Replacement > 0, we assessed the share of solar or wind potential [%] that would need to be exploited to replace the proposed hydropower capacity.
Results
Potential for electricity generation by reducing hydropower plant failure (maintenance potential)
HPPs in Africa have experienced a reduction of their installed capacity due to varying reasons. From 1903, when the first HPP listed in RePP Africa started into operation, to 2020, 137.5 GW of the theoretically installed capacity was not operational due to dysfunctional or not installed turbines (Fig. 3). The total losses varied from 1950 (total capacity of 0.6 GW) to 2020 (total capacity of 38 GW) between 1% (2020) and 24% (1968). The highest loss in terms of installed capacity was in 2011 and reached 4.2 GW (Fig. 3b). In 2022, a total of 29 HPPs are existing but not operating, accounting for overall losses of 490 MW.

a. Comparison of the total installed hydropower peak capacity (in GW; grey line) and the effectively available hydropower capacity (black line) in Africa from 1950 to 2020. b. Cumulated losses per year (in GW). Data: RePP Africa (Peters et al., 2023)
Potential for electricity generation by complementing existing hydropower reservoirs with floating photovoltaics (co-use potential)
Existing hydropower reservoirs cover 2.6 million ha in 34 African countries (Table S1). Covering 40% of each reservoir with FPV would result in 1.10 million ha of FPV area. This translates into a potential electricity generation of 22,596 terawatt hours (TWh) per year (Fig. 4), which equals three times the existing annual electricity consumption of the entire continent and 41 times the electricity potentially generated from proposed HPPs (IEA, 2019).

Potential electricity produced from covering 40% of existing reservoirs with floating photovoltaics (FPVs). Circles indicate existing hydropower reservoirs. Circle size corresponds to the potential electricity generation [GWh] from complementing the reservoirs with FPVs. The background map is coloured according to the annual global tilted irradiation at an optimum angle [kWh/m2]. Data: RePP Africa (Peters et al., 2023), Global Solar Atlas (WB, 2023)
The total annual electricity gains per country vary between 20.45 GWh projected for Madagascar (12 existing HPPs with a total capacity of 21 MW and a total reservoir area of 2.8 ha) to 4,880 TWh predicted for Zimbabwe (13 existing HPPs with a total capacity of 142 MW and a total reservoir area of 526 ∙ 103 ha; Figure S1a). Thirty countries with existing FPV potential have a hydropower capacity expansion proposed (Table S1). Except Madagascar, Malawi, Uganda, and Burundi, all the other 26 countries are capable to replace the proposed hydropower capacity by exploiting electricity from FPVs on existing reservoirs (Figs. 5, S1).

Floating photovoltaic power needed to replace proposed hydropower capacity. Countries are coloured according to the share of reservoir area that would need to be covered to replace the proposed hydropower capacity [%]. Colour intensity decreases with share. “no proposed hydropower ” indicates that no hydropower capacity of type reservoir storage is currently proposed (Data: RePP Africa (Peters et al., 2023), final revision November 2022). “no feasible reservoir” indicates that hydropower is proposed, but no feasible reservoirs exist for FPV installation. “not enough for replacement” indicates that the required electricity to replace hydropower surpasses the potential electricity generation of a 100% coverage of all existing hydropower reservoirs
We tested the sensitivity of the estimations by running scenarios for an FPV coverage of 20 and 60%, respectively. Results show the linear dependency with a decrease of 50% in electricity gains if a coverage of 20% is applied (11,298 TWh in total), and an increase of 50% if a coverage of 60% is applied (33,895 TWh in total). The total electricity outcome for a 20% coverage ranges from 10 GWh to 2440 TWh, and for a 60% coverage from 31 GWh to 7320 TWh. If a 20% coverage is applied, besides the above-mentioned countries also Rwanda and the Democratic Republic of Congo would not be capable to replace proposed hydropower capacity with FPV. If a 60% coverage is applied, the same countries, as in the 40% analysis, are capable to replace their proposed hydropower capacity, suggesting that this scenario would increase the overall continental electricity generation but not the share of countries with potential to entirely replace their proposed hydropower capacity.
The total reservoir area of the 640 non-hydropower reservoirs is 0.6 million ha, corresponding to one fifth of the total area from hydropower reservoirs. Consequently, a 40% FPV coverage results in additional 4,850 TWh, which is equal to 21% of the FPV electricity potentially generated from hydropower reservoirs.
In total, 27 countries can replace their proposed hydropower capacity with FPV capacity. Thereof, 13 countries are capable to replace the proposed electricity from hydropower by covering 1% or less of the country’s cumulated existing reservoir surface area with FPVs. Further six countries require less than 10% and five countries between 10 and 25%. Only Rwanda would need to cover 39% of its existing reservoirs and thus touches the proposed maximum reservoir coverage of 40% while Uganda would even surpass the suggested maximum and would need to cover 68% of its hydropower reservoirs (Fig. 5, Table S3).
Potential for electricity generation by solar and wind power replacing proposed hydropower plants (replacement potential)
All 36 countries with proposed hydropower capacity can replace the electricity gains by exploiting solar and wind alternatives (Table 1, Fig. 6, Table S1). In Burundi, Gabon, Liberia, Rwanda, and Sierra Leone, where no potential for onshore wind is available, the exploitation of solar PV potential is more than sufficient to replace the proposed hydropower capacity (Table S2). Among all countries, the mean surplus of generated electricity after replacing proposed hydropower is 371 TWh per year (Table S2).

Replacement of proposed hydropower capacity with solar PV and wind potential exploitation. Countries are coloured according to the total electricity [TWh] that would be produced per country if all potential “supply regions” were fully exploited. Data: RePP Africa (Peters et al., 2023); All-Africa dataset on energy model “supply regions” for solar PV and wind power (Sterl et al., 2022)
The total surplus is 21,000 TWh. The smallest surplus would be generated by Burundi (3.2 TWh, Table S2), the largest by Sudan (1,835 TWh). Projected reservoirs of proposed HPPs would inundate a total area of 4.6 million ha (Table 1). Exploiting the total area feasible for solar PV and onshore wind power in countries with proposed hydropower would require 174 million ha, which is 38 times the area required for the projected reservoir areas; yet, projected areas for onshore wind and solar PV include unsealed areas under solar panels and between wind turbines, which is in contrast to hydropower reservoirs. Reservoir inundation alters the entire projected area. Exploiting area feasible for wind and solar power instead would produce 25 times the electricity generated from proposed HPPs (14,294 TWh, Table 1). Using an equal area (summed up total) of the projected reservoir area for solar PV would provide for around 50% of the electricity generated from hydropower (276 TWh), while covering an area of the same size with wind power could even replace the entire proposed hydroelectricity (552 TWh). It should be noted that these summaries are based on continental averages and do not reflect the national differences in available solar PV and onshore wind potential (Figure S2c, d). While solar PV potential is nationwide available at comparable levels (capacity factor 19.07 ± 1.36), onshore wind potential differs strongly between countries (capacity factor 44.28 ± 7.52).
We further assessed the minimum potential of solar PV and wind that would be necessary to replace proposed hydropower capacity (Fig. 7). All countries could potentially replace their proposed hydropower capacity with solar PV (Fig. 7a). Burkina Faso, Mali, Morocco, Niger, and South Sudan can potentially replace all their proposed hydropower capacity by exploiting ≤1% of their solar PV potential. Further 19 country would need to exploit less than 10%. Only tropical countries with high hydropower dependencies such as Burundi, Cameroon, the Republic of Congo and the Democratic Republic of Congo would need to exploit between 34 and 43% to replace the proposed hydropower capacity (Table S3). The assessment for wind potential reveals that the potential for wind power is less abundant across the continent (Fig. 7b). In five countries, the wind power potential is not sufficient to replace the proposed hydropower capacity. Six countries do not have feasible wind potential to exploit. Eight countries could fully replace their proposed hydropower capacity by exploiting ≤1% of the country’s wind potential; for additional 11 countries, the share is below 10%. Benin and Cabo Verde would need to exploit shares above 70%, Uganda and Togo between 38 and 48%, and Angola, Eswatini, and Ghana between 14 and 21% (Table S3).

Shares of solar PV and wind power required to replace electricity from proposed hydropower capacity [%]. Colour intensity decreases with share of solar (a) or wind (b) potential that needs to be exploited to replace the proposed hydropower capacity. “no proposed hydropower” indicates that no hydropower capacity of type reservoir storage is currently proposed (Data: RePP Africa (Peters et al., 2023), final revision November 2022). “no potential for wind” indicates that data were recorded but resulted in no feasible wind potential within the country. “not enough for replacement” indicates that the required electricity to replace hydropower surpasses the potential electricity generation from wind potential exploitation. “no data” indicates that no data for solar or wind potential is available. This applies to island states [Data: Modelled electricity supply regions (Sterl et al., 2022)]
Discussion
The analysis of the RePP Africa database regarding hydropower capacity reduction reveals that HPPs have experienced pronounced losses with up to 4 GW in 2011 (Peters et al., 2023). That is more than each of the 39 countries with existing hydropower capacity has currently installed, except Angola. The reasons for a capacity reduction are described in the RePP Africa attributes and include project delay, cost-overruns, natural disasters that cause HPP damage, lack of maintenance, war damage, and other (Peters et al., 2023). Causes diminishing the available hydropower capacity are natural [e. g. reservoir sedimentation due to increased soil erosion from land use and climate change in semi-arid east Africa (Amasi et al., 2021)], technical [turbine failure caused by cavitation, erosion, fatigue, or material failure (Dorji & Ghomashchi, 2014)], political [political conflict (de Bruin et al., 2023; del Bene et al., 2018), or destruction from war (Tiepoh, 1992)]. A management aiming for efficient hydropower operation must identify and anticipate these risk factors and include them in long-term strategies to optimise the available hydropower capacity (Shaktawat & Vadhera, 2021). In addition, plant-level management must inform large-scale river basin management to fully account for risks caused by the operation of multiple hydropower dams in a connected river network (Opperman et al., 2023). To that point, risk assessment and failure avoidance should not only be aimed for future hydropower development but also for existing hydropower: policy regulations must assure that existing infrastructure is repaired, continuously maintained and fully functioning before new hydropower dams are commissioned. Therefore, costs of proposed HPPs should not only include material costs but should also be weighed against the long-term environmental costs of the increasingly fragmented river systems (Moran et al., 2018).
While the present study argues that additional HPP construction can be avoided by improving the performance of existing HPPs and exploiting renewable electricity from solar PV and wind resources, several challenges remain and require guiding policy regulations at national and regional level. Shifting from hydropower to wind and solar showed that not all countries are capable to fully replace their hydropower capacity due to the heterogenous distribution of renewable resources. Transnational treaties and policy guidelines have to assure that hydropower capacity losses can be compensated. Here, river basin organisations and regional power pools are frameworks that allow for transnational renewable electricity planning. In addition, the integration of variable resources will require storage and demand-driven renewable electricity management. Countries could create knowledge hubs to share knowledge and experience to continuously improve the integration of variable resources.
Moran et al. (2018) summarised that hydropower could only be part of a sustainable future if it moved from dam only to in-stream turbine and run-of-river technologies; in addition, the integration of volatile wind and solar power into dispatchable hydropower systems would play an increasingly important role in the twenty-first century. Building on that outlook, the findings prove that covering 40% of each existing hydropower reservoir with FPV would provide 41 times the electricity generated by the proposed hydropower capacity. In addition, FPV exploitation could cover three times the current electricity demand of the entire continent, supporting existing findings, which state that covering 10% of the world’s hydropower reservoirs with floating PV would install as much capacity as currently available from fossil fuel power plants (Almeida et al., 2022a). Thirty-one of 35 countries could fully replace proposed hydropower by exploiting electricity from their reservoirs. Despite the FPV analysis being only a proxy as it does not include losses due to spacing, system performance, and solar clipping, it confirms the huge potential for FPV in Africa which has been proven by other studies (Almeida et al., 2022a; Gonzalez Sanchez et al., 2021). FPV are still more cost-intensive than stand-alone systems, and licensing requires time and efforts (Essak & Ghosh, 2022). However, a major advantage of installing FPV on hydropower reservoirs is that electricity generation can be granted without further river damming and additional grid infrastructure.
Singh et al., (2023) reported in their recent study on the 63.5 MW Maithon HPP in India that FPV is more effective than land-based solar photovoltaic while saving water (0.0635 million m3) and running at lower costs than current electricity supply (US$ 0.024 per Watt less). Jin et al., (2023) further highlighted that 106 ± 1 billion m³ of annual water loss from evaporation could be avoided globally when covering 30% of reservoirs with FPV. Considering that most African countries are increasingly affected by drought (van Vliet et al., 2016), with central Africa being in particular increasingly vulnerable to cope with drought impacts (Ahmadalipour & Moradkhani, 2018), FPV installation would not only improve electricity generation but also save water losses from reservoirs. In that regard, it has been reported that even a coverage of 1% could save about 743 million cubic metres of water annually in Africa (Gonzalez Sanchez et al., 2021).
While Jin et al., (2023) considered reservoirs for all kinds of purposes, the present study focusses on hydropower sites because these locations have the advantage of an available electricity grid that reduces costs and impacts of grid infrastructure construction. We tested the additional outcome by calculating the total electricity production from a 40% coverage on non-hydropower reservoirs. Therefore, we selected 641 reservoirs from the GRanD database without hydropower as major or co-purpose (Lehner, Reidy Liermann, et al., 2011). The total area of these reservoirs was, despite the huge number of projects, only 20% of the total hydropower reservoir area. Compared to the FPV electricity generated on hydropower reservoirs, non-hydropower reservoirs provide a rather small electricity gain due to their smaller reservoir size. In addition, changing water levels that are for example part of water supply management can be a technical barrier for FPV installation and operation.
While hydropower reservoirs appear as an adequate choice for FPV expansion, there is a need for in-depth analyses on the optimum degree of coverage. Our assessment reveals that most countries (19 out of 27) could replace their proposed hydropower capacity by covering small shares of their reservoirs (<10%) with FPV. It yet lacks scientific concern on how much reservoir area should be covered: it has been reported that shading decreases water temperature and incoming sunlight, which reduces photosynthesis and oxygen production and thus impacts food webs and seasonal water circulation (Haas et al., 2020; Sahu et al., 2016). Our results indicate that even a low coverage will remarkably increase electricity production while avoiding large infrastructure.
Optimisation of existing HPPs and exploitation of floating solar PV are not for all African countries an option to replace announced hydropower capacity. In addition, a lack of knowledge on the effects of FPVs on reservoir dynamics discourages the covering of hydropower reservoirs without further environmental and economic assessments. The exploitation of feasible onshore wind and solar PV potentials would avoid proposed river fragmentation while preserving protected areas and assuring a certain vicinity to the existing road network. Wind and solar power also alter the natural dynamics of the physical resource they generate electricity from, but not the entire available wind or incoming sunlight. Solar PV converts around 20% of solar radiation and reflects the rest in form of thermal radiation or heat. This affects the radiation budget, but more research is required to fully understand, assess, and confirm large-scale effects (Stern et al., 2020). Confirmed are the small and medium scale effects of solar PV and concentrated solar power on land use and protected areas (Hernandez et al., 2015) (Fig. 6b). Wind power plants generate electricity by removing kinetic energy from the atmosphere, which is why large wind parks can cause wind speed reductions, limiting the exploitable energy (Miller & Kleidon, 2016). However, this effect mainly applies to surface wind and can be reduced with adequate planning. Other effects of wind power are restricted to the small scale (habitat loss (Hamed & Alshare, 2022; Loss et al., 2019; Millon et al., 2018; Popescu et al., 2020), noise pollution (van Kamp & van den Berg, 2018), perception of visual change (McKenna et al., 2021; Peri & Tal, 2021)) up to the medium scale (bird migratory routes (Marques et al., 2020), Fig. 8c).

Renewable power plants impact the physical dynamics of the resource they depend on. Hydropower plants operating with dam and reservoir cause effects on small, medium, and large scale (a). Solar (b) and wind power plants (c) do not alter the entire dynamic of the resource they depend on and mainly cause small and medium scale effects
Consequently, and according to current knowledge, solar and wind power infrastructure does not cause large-scale effects that are comparable to the up- and downstream alterations caused by an HPP that operates with a dam and reservoir. As an example, a river’s sediment supply is trapped behind dams which potentially leads to degradation of heavily populated deltas, such as the Mekong delta (Almeida et al., 2022b). Still, onshore wind and solar PV require more land per megawatt generated than hydropower, but in particular in African countries both renewable types will be less impacted by climate change and could be integrated with other land-use forms to create co-benefits, e.g. in the agricultural sector (Choi et al., 2021). Including climate change and socioeconomic pathway scenarios, Carlino et al. (2023) concluded that HPP construction will not be economically attractive beyond 2030 in sub-Saharan Africa. That paves the path for onshore wind and in particular solar power plant implementation, not only PV but also in form of concentrated solar power, and can also stimulate further innovation in both fields. Here, it is crucial to better identify and understand impacts associated to wind and solar infrastructure. Future research should also include life cycle assessments, as both, solar PV and wind power facilities require resources like rare earth elements (wind power plants) or silicon (solar PV) and have shorter lifetimes than hydropower or most fossil fuel infrastructure. Finally, the fact that HPP construction is likely to be economically unattractive for many African countries in the future underlines the need for transnational renewable energy management as potential areas of high onshore wind and solar potential often do not overlap with areas where high shares of hydropower capacity are proposed (Carlino et al., 2023; Sterl et al., 2022).
Driven by the need for climate-change mitigation and renewable energy supply, hydropower continues to be the RE technology of choice not only in African countries (IEA, 2021). The negative impacts related to hydropower dam and reservoir development have been scientifically reported and discussed in depth (Botelho et al., 2017; Schulz & Adams, 2019). Efforts to achieve a more sustainable development of hydropower plants are manifested in the Hydropower Sustainability Assessment Protocol (HSAP) from 2010 or in the newly adopted Hydropower Sustainability Standard from 2021, a global certification scheme and the first of its kind for RE projects (IHA, 2010, 2021). However, HSAP as voluntary and non-binding auditing tool was strongly criticised by the non-governmental organisation International Rivers as attempt to greenwash hydropower dams (International Rivers, 2013). As the debate continues and legally binding EIAs and SEAs still fail to fully account for large-scale effects of numerous hydropower dams on river dynamics, the results of this study contribute to the potential optimisation of existing infrastructure and alternatives.
In contrast to common research practices that focus on one possible optimisation pathway [e.g. replacing proposed hydro capacity with floating PV on existing reservoirs (Arnold et al., 2024)], our study combines multiple optimisation pathways due to the following reasons: (1) all analyses use data from RePP Africa and cover the entire continent; (2) the presentation of multiple pathways may better fit national needs and simultaneously stimulate research on combined optimisation pathways; and (3) the combined analyses of replacement, co-use, and replacement is to our knowledge a new add-on to the current research literature.
The all-Africa analysis allows for comparison at a continental scale; yet the large-scale approach comprises several limitations: data accuracy at such spatial level is limited, which is why national and local studies on renewable energy potential are a necessary add-on to inform precise small-scale planning. In particular, data on proposed hydropower projects are subject to uncertainty as plants might be cancelled, relocated or changed in their design (Peters et al., 2023). Furthermore, the available data on operation outages of existing plants are probably incomplete, because data of this type are barely publicly available. Yet, our analysis outlines that plant failure is often overlooked despite its crucial effect on available power capacity and that further research is necessary to fully exploit the existing renewable electricity capacity. In addition to data accuracy, the analyses of co-use and replacement potential are restricted to current system conditions. Integrating a scenario analysis under the consideration of socioeconomic and climate change could improve the analysis outcome, but was beyond the scope of this work (Carlino et al., 2023).
Building on the presented study findings, we identified several opportunities for future research. Using a continental approach, our study outlines hydropower plant maintenance, co-use of floating PV and hydropower reservoirs, and the full exploitation of feasible standalone solar PV and onshore wind are possibilities to avoid hydropower induced river fragmentation. In that regard, it is inevitable to better understand the impacts related to (floating) solar PV and wind infrastructure. Here, regional analyses need to be combined with local assessments to fully address the far-reaching effects on environment and society. In addition, the increased integration of intermittent resources will require an optimised use of existing (hydropower) storage capacity in combination with demand-driven renewable electricity supply systems. Therefore, research can provide a better understanding on how technologies such as artificial intelligence can support the implementation of smart grid management at regional scales.
One of the greatest challenges in African countries continues to be the lack of access for almost half of the continent’s population (Peters et al., 2024). At the same time, irreversible damage caused by unregulated renewable infrastructure expansion needs to be avoided in order to ensure sustainable systems in the future that provide important ecosystem services for human well-being (Rockström et al., 2023). In that regard, future research has to investigate how renewable transition scenarios can tackle the access gap. Off-grid and mini grid solutions might be more feasible than capacity expansion alone (Falchetta et al., 2019). In the past, the construction of large hydropower projects has led to cost overruns and consequently an increase in electricity costs, which is why flexible energy alternatives can be a more suitable option to provide electricity access within a short period of time (Ansar et al., 2014).
Conclusion
The implementation of all 524 proposed HPPs operating with a dam and reservoir would more than double the number of existing ones in Africa, causing a moderate to severe fragmentation of 75% of the entire African river volume. As costs for solar and wind power decline continuously while climate change threatens hydroelectricity generation, Carlino et al. (2023) project that most likely no new hydropower will be built in sub-Saharan Africa after 2030. Still, due to its dispatchable nature, existing hydropower will remain important to integrate variable wind and solar resources and simultaneously provide a stable renewable electricity grid (Moran et al., 2018). Science-based discussions are required to guide the path towards a renewable electricity mix that releases the dam-building pressure on African rivers. Based on the evidence provided by this study, we suggest the following recommendations:
-
The capacity of existing HPP infrastructure needs to be optimised as times of reduced operation and failure have diminished the available capacity in the past. If feasible, complementary use via hybrid renewable technology should be implemented to maximise renewable electricity generation without further land-use changes.
-
Policy makers should acknowledge the negative impacts of hydropower and assure a fully sustainable renewable energy transition by avoiding river fragmentation wherever possible. Therefore, the development of large-scale and basin-wide power plant assessment protocols could allow a weighing of hydropower impacts against wind and solar power impacts, including positive impacts of a potential agricultural co-use within solar and wind farms. When ranking RE power plants based on integrated impact assessments, it is necessary to acknowledge that a ranking might change depending on the impact indicators included.
-
Replacing proposed hydropower capacity with onshore wind and solar PV is technically feasible on the African continent. Based on our findings and other scientific evidence national and international policy frameworks must set the course for reconsidering hydropower as a renewable energy solution that is not per-se sustainable, and should point out alternatives.
In this regard, many African countries have the potential to lead the implementation of sustainable renewable electricity systems and skip a phase of heavy dependency on fossil fuels while sustaining the ecological integrity of rivers.
References
AfDB. (2023). Mobilizing Private Sector Financing for Climate and Green Growth in Africa. African Economic Outlook 2023. https://www.afdb.org/en/documents/african-economic-outlook-2023. Accessed 20 March 2024.
Ahmadalipour, A., & Moradkhani, H. (2018). Multi-dimensional assessment of drought vulnerability in Africa: 1960–2100. Science of the Total Environment, 644, 520–535.
Almeida, R. M., Schmitt, R. J., Castelletti, A., Flecker, A. S., Harou, J. J., Heilpern, S. A., Kittner, N., Mathias Kondolf, G., Opperman, J. J., Shi, Q., Gomes, C. P., & McIntyre, P. B. (2022b). Strategic planning of hydropower development: balancing benefits and socioenvironmental costs. Current Opinion in Environmental Sustainability, 56, 101175.
Almeida, R. M., Schmitt, R., Grodsky, S. M., Flecker, A. S., Gomes, C. P., Zhao, L., Liu, H., Barros, N., Kelman, R., & McIntyre, P. B. (2022a). Floating solar power could help fight climate change—let’s get it right. Nature, 606, 246–249.
Amasi, A., Wynants, M., Blake, W., & Mtei, K. (2021). Drivers, impacts and mitigation of increased sedimentation in the hydropower reservoirs of east Africa. Land, 10(6), 638.
Ansar, A., Flyvbjerg, B., Budzier, A., & Lunn, D. (2014). Should we build more large dams? The actual costs of hydropower megaproject development. Energy Policy, 69, 43–56.
Arnold, W., Giuliani, M., & Castelletti, A. (2024). Floating photovoltaics may reduce the risk of hydro-dominated energy development in Africa. Nature Energy. https://doi.org/10.1038/s41560-024-01510-0
Ates, A. M., Yilmaz, O. S., & Gulgen, F. (2020). Using remote sensing to calculate floating photovoltaic technical potential of a dam’s surface. Sustainable Energy Technologies and Assessments, 41, 100799.
Balasubramanian, S., & Balachandra, P. (2021). Effectiveness of demand response in achieving supply-demand matching in a renewables dominated electricity system: a modelling approach. Renewable and Sustainable Energy Reviews, 147, 111245.
Botelho, A., Ferreira, P., Lima, F., Pinto, L. M. C., & Sousa, S. (2017). Assessment of the environmental impacts associated with hydropower. Renewable and Sustainable Energy Reviews, 70, 896–904.
Carlino, A., Wildemeersch, M., Chawanda, C. J., Sterl, S., Thiery, W., & Griensven, A. Van. (2023). Climate change and the declining cost of solar power curb the need for hydropower expansion in Africa. Science, 381, 5848.
Choi, C. S., Ravi, S., Siregar, I. Z., Dwiyanti, F. G., Macknick, J., Elchinger, M., & Davatzes, N. C. (2021). Combined land use of solar infrastructure and agriculture for socioeconomic and environmental co-benefits in the tropics. Renewable and Sustainable Energy Reviews, 151, 111610.
de Bruin, S. P., Schmeier, S., van Beek, R., & Gulpen, M. (2023). Projecting conflict risk in transboundary river basins by 2050 following different ambition scenarios. International Journal of Water Resources Development, 40(1), 7–32.
del Bene, D., Scheidel, A., & Temper, L. (2018). More dams, more violence? A global analysis on resistances and repression around conflictive dams through co-produced knowledge. Sustainability Science, 13(3), 617–633.
del Torres-Sibille, A. C., Cloquell-Ballester, V.-A., Cloquell-Ballester, V.-A., & Artacho Ramírez, M. Á. (2009). Aesthetic impact assessment of solar power plants: an objective and a subjective approach. Renewable and Sustainable Energy Reviews, 13(5), 986–999.
Dorji, U., & Ghomashchi, R. (2014). Hydro turbine failure mechanisms: an overview. Engineering Failure Analysis, 44, 136–147.
Google Earth. (2023). Google Earth Pro (7.3.6.9345).
Erlewein, A. (2013). Disappearing rivers—the limits of environmental assessment for hydropower in India. Environmental Impact Assessment Review, 43, 135–143.
ESMAP. (2020). Global photovoltaic power potential by country. Global solar atlas. Washington, DC: World Bank Group.
ESRI. (2022). ArcGIS Pro (2.9.4).
Essak, L., & Ghosh, A. (2022). Floating photovoltaics: a review. Clean Technologies, 4(3), 752–769.
Falchetta, G., Pachauri, S., Parkinson, S., & Byers, E. (2019). A high-resolution gridded dataset to assess electrification in sub-Saharan Africa. Scientific Data, 6(1), 1–9.
Gonzalez Sanchez, R., Kougias, I., Moner-Girona, M., Fahl, F., & Jäger-Waldau, A. (2021). Assessment of floating solar photovoltaics potential in existing hydropower reservoirs in Africa. Renewable Energy, 169, 687–699.
Grill, G., Lehner, B., Lumsdon, A. E., Macdonald, G. K., Zarfl, C., & Reidy Liermann, C. (2015). An index-based framework for assessing patterns and trends in river fragmentation and flow regulation by global dams at multiple scales. Environmental Research Letters, 10(1), 015001.
Haas, J., Khalighi, J., de la Fuente, A., Gerbersdorf, S. U., Nowak, W., & Chen, P.-J. (2020). Floating photovoltaic plants: ecological impacts versus hydropower operation flexibility. Energy Conversion and Management, 206, 112414.
Hamed, T. A., & Alshare, A. (2022). Environmental impact of solar and wind energy-a review. Journal of Sustainable Development of Energy, Water and Environment Systems, 10(2), 1–23.
Hernandez, R. R., Hoffacker, M. K., Murphy-Mariscal, M. L., Wu, G. C., & Allen, M. F. (2015). Solar energy development impacts on land cover change and protected areas. Proceedings of the National Academy of Sciences of the United States of America, 112(44), 13579–13584.
IEA. (2019). Africa Energy Outlook 2019. https://www.iea.org/reports/africa-energy-outlook-2019. Accessed 18 March 2024.
IEA. (2021). World Energy Outlook 2021. https://www.iea.org/reports/world-energy-outlook-2021. Accessed 18 March 2024.
IEA. (2023). Energy Statistics Data Browser. https://www.iea.org/data-and-statistics/data-tools/energy-statistics-data-browser. Accessed 18 March 2024.
IHA. (2010). Hydropower Sustainability Assessment Protocol (May 2020). https://www.hydropower.org/publications/hydropower-sustainability-assessment-protocol. Accessed 20 March 2024.
IHA. (2021). Hydropower Sustainability Standard (June 2021). https://www.hydropower.org/sustainability-standard. Accessed 20 March 2024.
International Rivers. (2013). Greenwashing Dams: A Critique of the Hydropower Sustainability Assessment Protocol (HSAP). https://www.internationalrivers.org/wp-content/uploads/sites/86/2020/05/hsapfactsheet2013.pdf. Accessed 18 March 2024.
IRENA. (2022a). Renewable Cost Database Infographic. https://mc-cd8320d4-36a1-40ac-83cc-3389-cdn-endpoint.azureedge.net/-/media/Images/IRENA/Costs/Chart/Wind/irena_costs_fig_412.jpg?rev=fdf8bf9cd4f845cab11aef544decf58f. Accessed 18 March 2024.
IRENA. (2022b). Renewable Energy statistics. https://www.irena.org/publications/2022/Jul/Renewable-Energy-Statistics-2022. Accessed 20 March 2024.
IUCN. (2019). Independent technical review of the “Strategic Environmental Assessment for the proposed Rufiji Hydropower Project” in Selous Game Reserve World Heritage site, Tanzania (Issue November). www.iucn.org/resources/publications. Accessed on 29 April 2024.
Jin, Y., Hu, S., Ziegler, A. D., Gibson, L., Campbell, J. E., Xu, R., Chen, D., Zhu, K., Zheng, Y., Ye, B., Ye, F., & Zeng, Z. (2023). Energy production and water savings from floating solar photovoltaics on global reservoirs. Nature Sustainability, 6, 865–874.
Lehner, B., Reidy Liermann, C., Revenga, C., Vorosmarty, C., Fekete, B., Crouzet, P., Doll, P., Endejan, M., Frenken, K., Magome, J., Nilsson, C., Robertson, J. C., Rodel, R., Sindorf, N., & Wisser, D. (2011). Global Reservoir and Dam Database, Version 1 (GRanDv1): Dams, Revision 01. NASA Socioeconomic Data and Applications Center (SEDAC). https://doi.org/10.7927/H4N877QK. Accessed 20 March 2024.
Lehner, B., Liermann, C. R., Revenga, C., Vörömsmarty, C., Fekete, B., Crouzet, P., Döll, P., Endejan, M., Frenken, K., Magome, J., Nilsson, C., Robertson, J. C., Rödel, R., Sindorf, N., Wisser, D., Vörösmarty, C., Fekete, B., Crouzet, P., Döll, P., & Wisser, D. (2011). High-resolution mapping of the world’s reservoirs and dams for sustainable river-flow management. Frontiers in Ecology and the Environment, 9(9), 494–502.
Loss, S. R., Dorning, M. A., & Diffendorfer, J. E. (2019). Biases in the literature on direct wildlife mortality from energy development. BioScience, 69(5), 348–359.
Marques, A. T., Santos, C. D., Hanssen, F., Muñoz, A. R., Onrubia, A., Wikelski, M., Moreira, F., Palmeirim, J. M., & Silva, J. P. (2020). Wind turbines cause functional habitat loss for migratory soaring birds. Journal of Animal Ecology, 89(1), 93–103.
McKenna, R., Weinand, J. M., Mulalic, I., Petrović, S., Mainzer, K., Preis, T., & Moat, H. S. (2021). Scenicness assessment of onshore wind sites with geotagged photographs and impacts on approval and cost-efficiency. Nature Energy, 6(6), 663–672.
Meng, Y., Liu, J., Leduc, S., Mesfun, S., Kraxner, F., Mao, G., Qi, W., & Wang, Z. (2020). Hydropower production benefits more from 1.5 °C than 2 °C climate scenario. Water Resources Research. https://doi.org/10.1029/2019WR025519
Miller, L. M., & Kleidon, A. (2016). Wind speed reductions by large-scale wind turbine deployments lower turbine efficiencies and set low generation limits. Proceedings of the National Academy of Sciences of the United States of America, 113(48), 13570–13575.
Millon, L., Colin, C., Brescia, F., & Kerbiriou, C. (2018). Wind turbines impact bat activity, leading to high losses of habitat use in a biodiversity hotspot. Ecological Engineering, 112, 51–54.
Moran, E. F., Lopez, M. C., Moore, N., Müller, N., & Hyndman, D. W. (2018). Sustainable hydropower in the 21st century. Proceedings of the National Academy of Sciences, 115(47), 11891–11898.
Opperman, J. J., Camargo, R. R., Laporte-Bisquit, A., Zarfl, C., & Morgan, A. J. (2022). Using the WWF water risk filter to screen existing and projected hydropower projects for climate and biodiversity risks. Water. https://doi.org/10.3390/w14050721
Opperman, J. J., Carvallo, J. P., Kelman, R., Schmitt, R. J. P. P., Almeida, R., Chapin, E., Flecker, A., Goichot, M., Grill, G., Harou, J. J., Hartmann, J., Higgins, J., Kammen, D., Martin, E., Martins, T., Newsock, A., Rogéliz, C., Raepple, J., Sada, R., & Harrison, D. (2023). Balancing renewable energy and river resources by moving from individual assessments of hydropower projects to energy system planning. Frontiers in Environmental Science, 10(1), 1–26.
Peri, E., & Tal, A. (2021). Is setback distance the best criteria for siting wind turbines under crowded conditions? An Empirical Analysis. Energy Policy, 155, 112346.
Peters, R., Berlekamp, J., Kabiri, C., Kaplin, B. A., Tockner, K., & Zarfl, C. (2024). Sustainable pathways towards universal renewable electricity access in Africa. Nature Reviews Earth & Environment, 5, 137–151.
Peters, R., Berlekamp, J., Tockner, K., & Zarfl, C. (2023). RePP Africa—a georeferenced and curated database on existing and proposed wind, solar, and hydropower plants. Scientific Data, 10(1), 16.
Popescu, V. D., Munshaw, R. G., Shackelford, N., Montesino Pouzols, F., Dubman, E., Gibeau, P., Horne, M., Moilanen, A., & Palen, W. J. (2020). Quantifying biodiversity trade-offs in the face of widespread renewable and unconventional energy development. Scientific Reports, 10(1), 7603.
Pouran, H. M., Lopes, M. P. C., Nogueira, T., Branco, D. A. C., & Sheng, Y. (2022). Environmental and technical impacts of floating photovoltaic plants as an emerging clean energy technology. Iscience. https://doi.org/10.1016/j.isci.2022.105253
Ritchie, H. (2022). How does the land use of different electricity sources compare? OurWorldInData. https://ourworldindata.org/land-use-per-energy-source. Accessed 18 March 2024.
Rockström, J., Gupta, J., Qin, D., Lade, S. J., Abrams, J. F., Andersen, L. S., Armstrong McKay, D. I., Bai, X., Bala, G., Bunn, S. E., Ciobanu, D., DeClerck, F., Ebi, K., Gifford, L., Gordon, C., Hasan, S., Kanie, N., Lenton, T. M., Loriani, S., & Zhang, X. (2023). Safe and just earth system boundaries. Nature, 619(7968), 102–111.
Sahu, A., Yadav, N., & Sudhakar, K. (2016). Floating photovoltaic power plant: a review. Renewable and Sustainable Energy Reviews, 66, 815–824.
Schulz, C., & Adams, W. M. (2019). Debating dams: the world commission on dams 20 years on. Wiley Interdisciplinary Reviews: Water, 6(5), 1–19.
Shaktawat, A., & Vadhera, S. (2021). Risk management of hydropower projects for sustainable development: a review. Environment, Development and Sustainability, 23, 45–76.
Shivarama Krishna, K., & Sathish Kumar, K. (2015). A review on hybrid renewable energy systems. Renewable and Sustainable Energy Reviews, 52, 907–916.
Singh, N. K., Goswami, A., & Sadhu, P. K. (2023). Energy economics and environmental assessment of hybrid hydel-floating solar photovoltaic systems for cost-effective low-carbon clean energy generation. Clean Technologies and Environmental Policy, 25(4), 1339–1360.
Sterl, S., Hussain, B., Miketa, A., Li, Y., Merven, B., Ben Ticha, M. B., Elabbas, M. A. E., Thiery, W., & Russo, D. (2022). An all-Africa dataset of energy model “supply regions” for solar photovoltaic and wind power. Scientific Data, 9(1), 664.
Stern, R., Amer, M., Müller, J., Tatarinov, F., Segev, L., Rotenberg, E., & Yakir, D. (2020). “ Solar panels forest” and its radiative forcing effect: preliminary results from the Arava Desert. EGU General Assembly Conference Abstracts, 18924.
Sterl, S., Vanderkelen, I., Chawanda, C. J., Russo, D., Brecha, R. J., van Griensven, A., van Lipzig, N. P. M., & Thiery, W. (2020). Smart renewable electricity portfolios in West Africa. Nature Sustainability, 3(9), 710–719.
Tiepoh, M.G.-N. (1992). The Liberian civil war: the future of liberian refugees. Refuge, 11(3), 14–17.
UN. (2015). Transforming our world: The 2030 Agenda for sustainable development. https://sdgs.un.org/2030agenda. Accessed on 20 March 2024.
van Kamp, I., & van den Berg, F. (2018). Health effects related to wind turbine sound, including low-frequency sound and infrasound. Acoustics Australia, 46(1), 31–57.
van Vliet, M. T. H., van Beek, L. P. H., Eisner, S., Flörke, M., Wada, Y., & Bierkens, M. F. P. (2016). Multi-model assessment of global hydropower and cooling water discharge potential under climate change. Global Environmental Change, 40, 156–170.
Wan, W., Zhao, J., Popat, E., Herbert, C., & Döll, P. (2021). Analyzing the impact of streamflow drought on hydroelectricity production: a global-scale study. Water Resources Research. https://doi.org/10.1029/2020WR028087
Wang, T., Chang, P., Huang, Y., Lin, T., Yang, S., Yeh, S., Tung, C., Kuo, S., Lai, H., & Chen, C. (2022). Effects of floating photovoltaic systems on water quality of aquaculture ponds. Aquaculture Research, 53(4), 1304–1315.
Wang, Y., Tian, Y., & Cao, Y. (2021). Dam siting: a review. Water, 13(15), 1–21.
WB. (2023). Global Solar Atlas. https://globalsolaratlas.info. Accessed on 20 March 20204.
Zarfl, C., Lumsdon, A. E., Berlekamp, J., Tydecks, L., & Tockner, K. (2015). A global boom in hydropower dam construction. Aquatic Sciences, 77(1), 161–170.
Acknowledgements
C.Z. and R.P. acknowledge the funding through the Excellence Initiative at the University of Tübingen, funded by the German Research Foundation (DFG) and the BMBF. We also acknowledge financial support by the DFG and the Open Access Publishing Fund of the University of Tübingen. We thank Rebekka Knauer for supporting the floating photovoltaic data analysis as part of her scientific practice. We thank Lana Graves and Paul Mundy for proofreading and language editing of the manuscript.
Funding
Open Access funding enabled and organized by Projekt DEAL. The research received no external funding.
Author information
Authors and Affiliations
Contributions
R.P. and C.Z. designed the research. R. P. collected data, performed analysis, and visualised graphics. C. Z., K. T., and J. B. substantially contributed to the interpretation of results. R.P. outlined the manuscript and all the co-authors revised the work carefully. All the authors have read and agreed to the published version of the manuscript.
Corresponding author
Ethics declarations
Competing interests
The authors declare that they have no competing interests.
Additional information
Publisher's Note
Springer Nature remains neutral with regard to jurisdictional claims in published maps and institutional affiliations.
Supplementary Information
Rights and permissions
Open Access This article is licensed under a Creative Commons Attribution 4.0 International License, which permits use, sharing, adaptation, distribution and reproduction in any medium or format, as long as you give appropriate credit to the original author(s) and the source, provide a link to the Creative Commons licence, and indicate if changes were made. The images or other third party material in this article are included in the article's Creative Commons licence, unless indicated otherwise in a credit line to the material. If material is not included in the article's Creative Commons licence and your intended use is not permitted by statutory regulation or exceeds the permitted use, you will need to obtain permission directly from the copyright holder. To view a copy of this licence, visit http://creativecommons.org/licenses/by/4.0/.
About this article

Cite this article
Peters, R., Berlekamp, J., Tockner, K. et al. Electricity mix from renewable energies can avoid further fragmentation of African rivers. Sustainable Energy res. 11, 15 (2024). https://doi.org/10.1186/s40807-024-00110-6
Received:
Accepted:
Published:
DOI: https://doi.org/10.1186/s40807-024-00110-6