- Review
- Open access
- Published:
Design models for small run-of-river hydropower plants: a review
Sustainable Energy Research volume 10, Article number: 3 (2023)
Abstract
Hydropower plants are among the most efficient and reliable renewable energy systems in the world as far as electricity production is concerned. Run-of-river hydropower plants seem more attractive than conventional hydroelectric plants since they can be a cheaper and environmentally friendly alternative. However, their expected energy production pattern heavily depends on several construction variables that need an appropriate design using specific models. This paper analyzes several existing models used for the calculation of the diameter and thickness of a penstock, the optimal selection and implantation (admissible suction head) of a turbine, to estimate the energy produced and expected cost of small hydropower projects for grid-connected and off-grid/micro-grid applications. This review particularly brings out the specificities of each of the models to suggest the most appropriate model according to the context of study and proposes methods to use them more efficiently. This review can be used as a guide in the design and simulation of run-of-river hydropower plants, thus helping in the assessment of the economic feasibility of projects that usually requires a high level of experience and expertise.
Highlights
-
A critical review focused particularly on run-of-river hydropower plant design models was carried out.
-
Several calculation models including diameter and thickness of a penstock, admissible suction head of a turbine, and cost and energy production estimation for grid-connected applications are collected and analyzed.
-
Hydropower models for design and generation profile prediction presented can be used to optimally come against the variability problem of run-of river plants.
-
The paper can be used as a guide in the design and simulation of run-of-river hydropower plants with appropriate models.
Introduction
Till date, more than 81% of the world's energy consumption comes from fossil sources despite the setbacks related, such as environmental impact and the gradual disappearance of the resource (Safarian et al., 2019). Global energy demand remains constantly growing, but the contribution of renewable energy sources is still estimated to be very low (13.7%) (Safarian et al., 2019; Yildiz & Vrugt, 2019). Renewable energy sources (wind, solar, geothermal, biomass and hydropower) are cleaner, sustainable and environmentally friendly sources, meaning they should be harnessed as much as possible.
Among all the renewable energy sources, hydropower, representing about 2.5% of the world energy resource and about 15.9% of the global electricity generation, is among the most efficient and reliable as far as electricity generation in the world is concerned (Bozorg Haddad et al., 2011; Hydropower status report, sector trends & insights, 2019; Jadoon et al., 2020; Safarian et al., 2019). A hydro-power plant harnesses the energy of moving water to drive a turbine, which in turn will run a generator for electricity production. This technology is well understood and has many advantages (Breeze, 2005), among which a relatively low-marginal-cost and low greenhouse gas emission (Stoll et al., 2017), with nearly constant prices over the years (Ghosh & Prelas, 2011; Sattouf, 2014).
Usually, a typical hydropower plant is made of a dam (which creates the reservoir), a trash rack (that prevents debris from entering the intake), a water tunnel, a penstock (to divert the water to the turbine), a speed governor (controlling wicket gates to permanently adapt water flow variations to the energy demand), a turbine and a generator (Fig. 1a) (Acakpovi et al., 2014; Pagès et al., 2003; Singh & Chauhan, 2011). As for run-of-river hydropower plants, it is generally a weir which is responsible for diverting the water from the river toward the intake. The water usually gets to the turbine after crossing a desilting tank. Water can also be brought to a forebay by a canal, and then the penstock will convey it to the turbine (Vougioukli et al., 2017). Figure 1b shows the components of run-of-river hydropower plants.

a Typical hydropower plant with reservoir; b Run-of-river hydropower plant
The main particularity of run-of-river projects is that they do not need large reservoirs, which leads to several benefits. First, their construction time is shorter and their overall cost is lower compared to storage plants projects of this same capacity (Ibrahim et al., 2019). Second, they pose less problems of inundation and sedimentation, have a less harmful impact on fish migration, and decrease the problem of high rehabilitation, the disorder at the level of navigation and the problem of people moving, aspects that usually go with large-scale hydropower projects (Kumar & Katoch, 2014). Another advantage of run-of-river hydropower projects is the fact that they drive generators with small turbines that can be easily manufactured locally, thus promoting job creation and economic development through local industry (Goodland, 1994). Because of these advantages mentioned above, it is easier to get public and government’s acceptance for run-of-river hydropower projects as compared to storage plant projects, which need large submergence areas (Kumar & Katoch, 2014).
In the work of Korkovelos et al. (2018), it was found that the small-scale (1–10 MW) hydropower potential in Sub-Saharan Africa is estimated at 21,800 MW, and run-of-river hydropower plants are generally categorized as small hydropower plants (Bozorg Haddad et al., 2011; Safdar et al., 2020; Vougioukli et al., 2017). An overview of the small hydropower potential of each of the 44 Sub-Saharan African countries can be seen in Appendix 1 (Korkovelos, et al., 2018). In view of this great potential, it emerges that the small-scale hydropower and consequently run-of-river systems can be a very suitable option for rural electrification in Africa (Okedu et al., 2020). Indeed, they have made a significant contribution to the sustainable development of rural and remote areas in various developing countries these last years (Malhan & Mittal, 2021). There is no internationally agreed definition of small hydropower plants. The level of development of a country makes it possible to classify hydropower plants as shown in the Appendix 2 (Bhat & Prakash, 2014; Elbatran et al., 2015; Mishra et al., 2012; Ohunakin et al., 2011).
Despite the fact that the use of run-of-river hydropower plants goes with many advantages (Casila et al., 2019; Yildiz & Vrugt, 2019), the intense variability of their resource can have a significant impact on the quality of electricity and on the balance of the grid. Many hydropower models for design and generation profile prediction are used to come against this variability problem. Each of the models has its singularity. It is for this reason that this review regroups them to present their particularities and to orientate their choices for more efficient use. Moreover, the prefeasibility study of small hydropower projects generally represents a significant proportion of overall project costs and requires a high level of experience and expertise (Punys et al., 2011). Hence, it is important to analyze existing models to provide the elements, which can facilitate optimal design and operation of run-of-river hydropower plants from the least possible data (average daily flow and gross head), and less expertise possible in a single document.
However, the recent literature is lacking extensive literature reviews on modeling run-of-river projects. In Kuriqi et al., (2021), the major ecological impacts of run-of-river projects were reviewed, yet modeling factors were not on major focus. The review in Sasthav and Oladosu (2022) focused on only low-head run-of-rivers in the United States with some yet limited modeling perspectives. Finally, the authors in Singh and Singal (2017) reviewed the system operation of several hydro plants, yet the specific detailed models were not in the focus. Therefore, it turns out that reviewing design methodologies for run-of-river projects is not only timely but also needed.
This paper aims at examining numerical models for the optimal design of run-of-river hydropower plants without pondage. This is done with a particular focus on the optimal design of a penstock (calculation of the diameter and thickness), the optimal selection and implantation (admissible suction head) of a turbine, the estimation of energy production for central-grid applications and the estimation of the cost of small hydropower projects. More in detail, the main novelties of this study lay in (a) identifying and reviewing all major technical and economic parameters needed for the optimal design of run-of-river project, based on relevant literature and in-field experience, and (b) proposing a classification of the reviewed models to be possibly used as a reference by scholars and practitioners in the field.
Overview of run-of-river hydropower plants
Run-of-river hydropower plants are characterized by the fact that they do not have a water reserve allowing a seasonal regulation (Bozorg Haddad et al., 2011; Goodland, 1994; Pagès et al., 2003; Yildiz & Vrugt, 2019). They use the natural flow on river of water from upstream. Therefore, these plants are less flexible than hydropower plants with large reservoirs because their electricity output depends on the availability of water in the river. This particularity makes the energy generated proportional to water inflow, which is why the amount of power produced by run-of-river hydropower plants varies considerably throughout the year. Multiple hydraulic turbines can be set up to have a better control on these flow variations (Bozorg Haddad et al., 2011) and vary depending on the run-of-river hydropower plant configurations.
These configurations, regrouped into the diversion type plants without dams, the weir type plants and the river current systems type plants (using kinetic energy devices), can involve penstock pipes, open channels, barrages and other diversion methods.
In the diversion type plants without dams, a portion of the water diverted from fast flowing rivers can be used directly to feed a penstock. This will move the water down to the turbine (Fig. 2a), whereas in other cases, the intake system instead feeds a diversion channel first before reaching the penstock passing through a forebay tank (Fig. 2b) (Aquaret, 2012; Publishers, 2015).

Run-of-river in diversion type plants a without forebay tank and b with forebay tank
In the weir type plants (Fig. 3a, c), the capacity of the system is directly linked to the existing flow of water through the dam which maintains the river flow (Penche, 2004; Publishers, 2015). There is also a weir type plant where the water of the river damned with a weir is allowed to flow through low-head turbines housed in the weir to generate electricity (Fig. 3b) (Aquaret, 2012; Publishers, 2015).

Run-of-river in weir type plants a directly linked to the existing flow of water with floating intake b with flow through low-head turbines housed and c directly linked to the existing flow of water with protected intake
The river current systems type plants are using kinetic energy devices (reaction turbines, small bulb turbines, underwater turbines, oscillating hydrofoils, and venturi devices) installed directly into flowing water to harness the kinetic energy of the water of the river; hence, these systems are generally small. This type can make use of existing structures such as bridges (Aquaret, 2012; Publishers, 2015) (Fig. 4).

Run-of-river in river current systems type
Generally, run-of-river hydropower projects deal with two main activities. One main activity includes civil works, such as diversion weir and intake, desilting chamber, power channel including headrace channel, forebay and spillway, penstock, powerhouse building, or tailrace channel. The other main activity includes electromechanical equipment, namely turbines with governing systems and generators with excitation systems, switch gears, control and protection equipment, among others, which are all sheltered by the powerhouse (Mishra et al., 2012; Vougioukli et al., 2017; Yildiz & Vrugt, 2019).
As introduced, there are several configurations and components to take into consideration while dealing with run-of-river hydropower projects, of which the penstock and the turbine turn out to be the most relevant, hence heavily discussed in this study. After discussing the models for the design of a penstock (diameter and thickness), then the choice of the appropriate selection and implementation of the turbine (admissible suction head) for a given run-of-river without pondage project will be detailed.
The models presented in this review are appropriate for the design of a run-of-river hydropower plant that has a penstock and no reservoir, independently of the configuration chosen. Changes can occur if there is a reservoir because its presence will make sure that the flow reaching the turbine is not always the direct flow of the stream available for the plant, but this case will not be discussed in this paper.
Penstock models
To make the right choice of a penstock for a project, materials, diameter, wall thickness, type of joint and relative cost must be taken into account (Fraenkel et al., 1999; Penche, 2004).
Several methods used to determine the diameter and the wall thickness of the penstock of a small hydropower plant are presented in this subsection (Fig. 5).
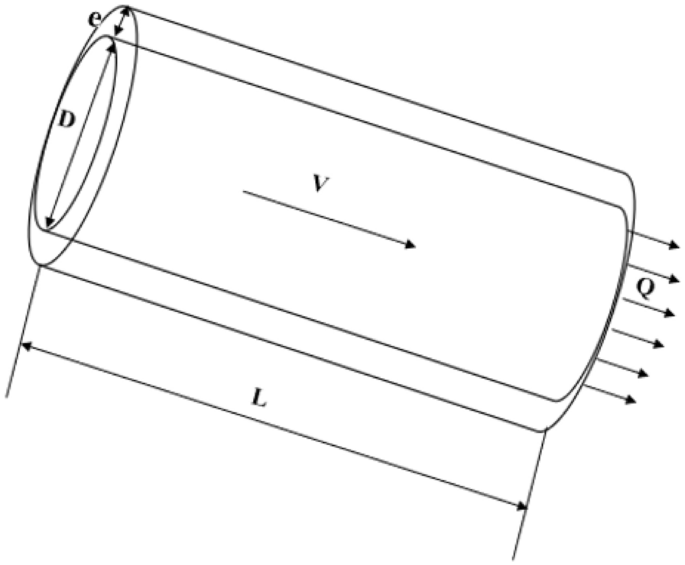
Penstock
Calculation models of the penstock diameter
To calculate the diameter of a penstock, one of the equations presented in the Table 1 can be used considering its limits.
Selecting a diameter can also be an iterative process. It is even the best way of selecting the appropriate diameter of a penstock since all the formulae have their limits. This method involves starting with a first estimate of what might be a suitable diameter obtained via one of the formulae of Table 1 and then adjusting that estimate according to the calculated head losses and the price (Fraenkel et al., 1999).
For example, the objective can be the restriction of the total head loss between 2 and 10%. Usually, the head loss is less than 4% according to the ESHA standard (Obinna Ajala Chinyere & Emmanuel Osiewundo Ojo, 2017). While using this method, one of the formulae of the Table 1 can be used for a first estimation of the diameter, which will serve as a guide diameter; the first value for the iteration process to get the best penstock. Obinna et al. (2017) proceeded like that using the first empirical Eq. (5) of the Table 1 to calculate the first estimate of a diameter to design a penstock for Kuchigoro Small Hydro Project.
Calculation models of the penstock thickness
The thickness of the penstock must be able to guarantee sufficient rigidity to withstand the maximum possible overpressure, which occurs when the valve that links the penstock to the turbine is closed in a short time (Fraenkel et al., 1999). This means that the determination of the minimum thickness of a penstock depends on the expected surge pressure and the properties of the penstock (Fraenkel et al., 1999).
The surge pressure head is calculated by the Eqs. (1), (2), (3) and (4) below:
with
with
where hsurge
hsurge: Surge pressure head (m)
hmax: Maximum possible pressure (m)
hgross: Gross head (m)
C: Velocity of the pressure wave through the water (m/s)
V: Flow velocity with valve fully open (m/s)
\(\rho\): Density of water (kg/m3)
\(k\): Bulk Modulus of water (N/mm2)
\(E\): Young’s Modulus of Elasticity for penstock material (N/m2)
\(D\): Penstock diameter (mm)
\(e\): Penstock wall thickness (mm)
emin: Penstock minimum wall thickness (mm)
\(:\) Gravitational acceleration (m/s2)
\(\sigma\): Ultimate tensile strength of penstock material (N/mm2)
\(F\): Safety factor, typically 3.
It is worth noticing that the expressions of the minimum thickness \({e}_{\text{min}}\) and the expected surge pressure \({h}_{\text{surge}}\) are mutually dependent. Hence, an iterative approach is needed to estimate the value of the thickness (Fraenkel et al., 1999).
The algorithm allowing the calculation of the thickness of a penstock is presented as below (Fraenkel et al., 1999):
-
1.
Initialize a first estimate of \({e}_{0}\)
-
2.
Calculate c, \({h}_{\text{max}}\) and \({e}_{\text{min}}\) for the current iteration i
-
3.
Compare \({e}_{i}\) and \({e}_{\text{min}}\):
-
a.
if \({e}_{i}<\) \({e}_{\text{min}}\), update \({e}_{i+1}={e}_{i}+\Delta {e}_{i}\) and go to 2
-
b.
if \({e}_{i} \gg\) \({e}_{\text{min}}\), set \({e}_{i+1}={e}_{\text{min}}\), and go to 2
-
c.
if \({e}_{i} \cong {e}_{\text{min}}\) and \({e}_{i}\ge {e}_{\text{min}}\), go to 4
-
a.
-
4.
\({e}_{i}\) should be increased by 1.5 mm while dealing with mild steel pipes to take into consideration corrosion effects.
According to Ramos et al. (2000), the most dangerous situation the penstock must withstand occurs when it is subjected to a great depression due to the appearance of the vacuum. Thus, the minimum thickness a steel penstock with a diameter D must have to withstand such condition is calculated through the inequation below:
While using this method, 1 mm must be added to the value of the penstock thickness calculated to take into account the effects of corrosion (Ramos et al., 2000). In the numerical model of Yildiz and Vrugt (2019), the minimum thickness of the penstock is calculated using this method.
ESHA (Penche, 2004) also proposed other equations for the estimation of the minimum wall thickness that will make the penstock rigid enough to be handled without danger of deformation in the field. The equations are presented below:
where D is the diameter in m
where D is the diameter in mm.
The Eq. (23) with an additional margin of 1.2 was also used for feasibility studies of micro-hydro-power plant projects in Cameroon (Kengne Signe et al., 2017a; Kengne Signe et al., 2017b).
In conclusion, for the calculation of the thickness of a penstock, Eqs. (1), (2), (3) and (4) seem to be better appropriate since they can be used for all types of penstock material compared to the other models used only for steel pipes. However, their iteration process makes them a relatively more complex model that needs higher computational time and resources to be used, yet modern computers are well capable of bearing the burden.
Equations (22) and (23) guarantee the survival of the penstock during its manipulation in the field. This is why it might be more cautious to calculate three minimum thicknesses using Eq. (3), (22) and (23) to ultimately choose the largest value.
Models for the selection of hydraulic turbines
Turbine is made of (1) a nozzle that directs the flow to the runner, (2) a runner that converts the hydraulic energy into mechanical work and (3) a shaft that transfers the mechanical work to the electrical generator (Sangal et al., 2013), components that altogether determine the flexibility options and total energy production from the water flow. Commonly, there are two principal categories of hydro-turbines: impulse turbines, such as Pelton, Cross-flow and Turgo, for sites with high head and reaction turbines, such as propeller, Kaplan, Francis, screw and hydro-kinetic turbines, for sites generally with lower head and higher flows (Okot, 2013; Sangal et al., 2013)). Typically, the head and flow available on a site are the principal criteria that orientate the choice of a hydro turbine for a given project (Paish, 2002). Nevertheless, it is also important to use the efficiency curves of turbines (like the one of Fig. 6) to know how the turbines will react to variations in flow rates and therefore determine the one which is the most suitable for a given installation site and river system (Okot, 2013; Yildiz & Vrugt, 2019).
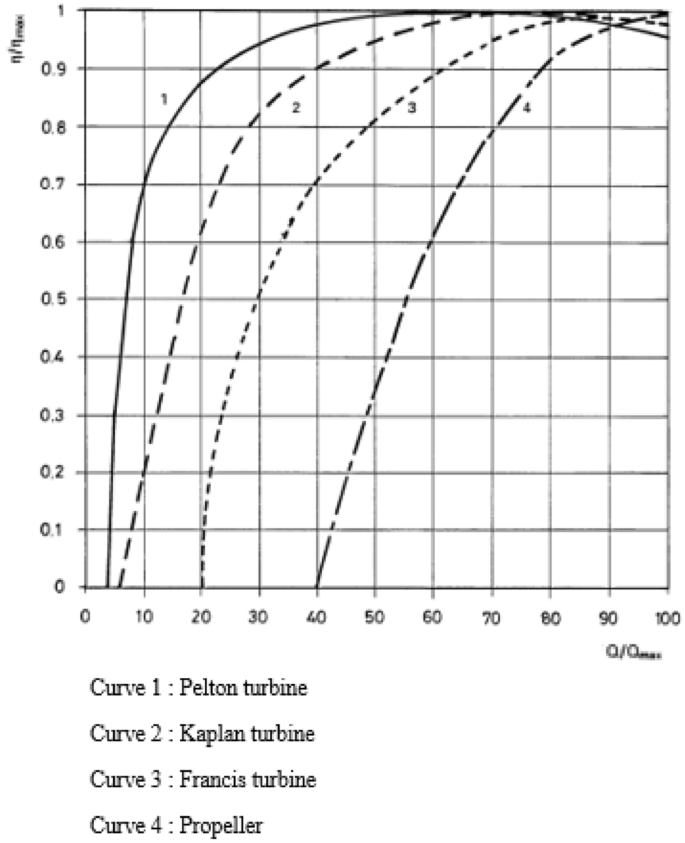
Typical small hydro-turbines efficiencies (Chapallaz et al., 1995)
Determination models of the nominal discharge
The choice of the nominal flow is important since the height of a proposed site does not really vary meanwhile the available flow varies a lot (Bezabih, 2021). Based on the flow duration curve, it is possible to determine the nominal flow of a hydropower plant. It is the maximum flow rate that can pass through the penstock and the turbine without causing inadmissible energy losses (Dubas & Pigueron, 2009). The nominal flow must be chosen carefully to have a hydro-project profitable and efficient enough. A good choice should make sure the plant works all the time at its maximum capacity while exploiting efficiently the hydraulic energy of the water (Dubas & Pigueron, 2009).
There are different ways to choose the nominal flow of a hydropower plant. The simplest way is to fix the mean annual flow as the nominal flow. In the work of Adejumobi and Shobayo (2015) on the optimal choice of turbines for small hydropower plants, the average annual flow has been considered as the nominal flow. According to Heteu and Martin (2001), the choice of the nominal flow depends on the use of the plant. If the hydropower plant is the only source of supply to the consumer or the mini-grid, the nominal flow is the flow reached for at least 250 days a year. Otherwise, the production must be the most important factor and the optimum flow in that case will be around a flow reached for a period between 50 and 90 days a year. This methodology was used for feasibility studies of micro-hydro-power plant projects in Cameroon while assessing the fall river of Kemken and Bakassa (Kengne Signe et al., 2017a; Kengne Signe et al., 2017b). For those two projects, systems were decentralized, and the flow rate of equipment used was the one, which exceeded 250 days per year (Kengne Signe et al., 2017a; Kengne Signe et al., 2017b). In the same way, Hanggi and Weingartner (2012) also mentioned in their work that the choice of the nominal flow depends on the desired operation or purpose of the hydropower plant. They recommended that for hydropower plants operating in an isolated network, the approximate values of the nominal flow should be less or equal to the flow reached for at least 255.5 days a year while that for hydropower plants in parallel operation should be between the flow reached for at least 54.75 days to 91.25 days a year.
According to Alexander and Giddens (2008), the equation below can also be used to find the optimum discharge for any diameter.
where \(\lambda\) is the friction factor determined by the surface roughness of the penstock material (–), \({H}_{\text{g}}\text{ is}\) the gross head (m), S is the penstock slope = \({H}_{\text{g}}\) /L (–), D is the diameter of the penstock (m) and h is the head loss (m).
As with the formula of the calculation of the diameter of a penstock relying on the cost and the slope of the penstock presented in Table 1 (Eq. (17)), the objective is to have the head loss h = \({H}_{\text{g}}\) /3 to achieve maximum power.
Voros et al. (2000) worked on how to design small hydroelectric plants while maximizing the economic benefits of the investment and they proposed an empirical equation allowing determining the optimum nominal flow rate of the hydro-turbines and concluded that it can be used safely for short-cut design purposes. This empirical equation is presented below:
where \({q}_{*50}\) is flow rate duration curve parameter, defined as \(/\), \(q_{*\min }\) is flow rate duration curve parameter, defined as \(Q_{*\min }\)\(/\), \(q_{\max }\) is hydro turbine maximum working flow rate fraction, Qmax is annual highest stream flow rate (m3/s) and \(\gamma\) is short-cut model parameter with the values 0.422 for Francis turbines, 0.369 for Pelton turbines and 0.364 for Axial turbines.
In the study of Munir et al. (2015), a new parameter, known as the inverse incremental energy was used to select the optimum flow of the hydropower plant at head of Upper Chenab Lower (UCC) at Bamanwala. The nominal flow was selected through comparison of increment of energy with respect to change in flow. A relationship between inverse incremental energy and flow was plotted for the selection of the appropriate flow.
In conclusion, as seen above, there are several methodologies for the determination of the nominal discharge of a small hydropower project. Each of these methods can be used in specific contexts and situations as a starting point for the assessment of the potential of hydropower sites. However, to determine the best nominal discharge for a better exploitation of the energy potential of a natural stream or for a more economical project, we recommend using of an optimization algorithm related to appropriate objectives functions.
Selection of the appropriate type of turbine
The net head is the first criterion to estimate a suitable turbine for a hydropower project (Pagès et al., 2003; Paish, 2002; Penche, 2004) and Table 2 gives the range of operating heads by type of turbine.
A first technique used in the selection of turbines makes use of charts like that in Fig. 7 that depict the expected suitable ranges of net head and water flow admissible by technology (Paish, 2002; Penche, 2004). However, it is important noticing that the specific curve is strictly manufacturer-specific; hence, that plot shall be used as a preliminary reference.
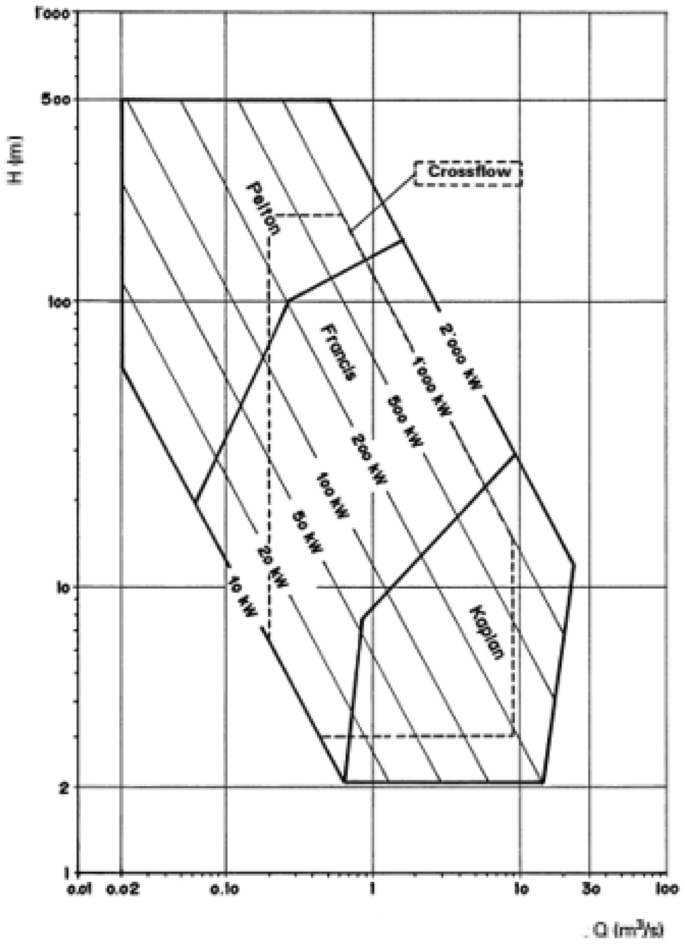
: Typical range chart of turbines (Chapallaz et al., 1995)
Another criterion that can also orientate in the selection of the appropriate turbine type is the specific speed. The specific speed is the speed in rpm of a turbine with a unit head and a unit output power. Impulse turbines have low specific speeds; Francis turbines have medium specific speeds and propeller or Kaplan have high specific speeds (Ramos et al., 2000). The specific speed of a turbine can be calculated as follows:
with
and
where \(Q\) is the discharge in m3/s, \(n\) the rotational speed of the turbine in rpm, \(E\) the specific hydraulic energy of the machine in J/kg, \(f\) the frequence of the electric system in Hz, \(p\) the number of pairs of poles of the trubine’s generator, \(g\) the gravitational constant in m/s2 and \({H}_{\text{net}}\) the net head in m.
Without a speed increaser, the rotational speed of the turbine has the same value than the rotational speed of its generator. The rotational speeds of asynchronous generators will be 1 to 2% higher than the value of rotational speeds of the corresponded synchronous generators, a slight over-speed being necessary to create the magnetic field in the machine (Chapallaz et al., 1995).
According to Chapallaz et al. (1995), the maximum speed of the generator must be limited to 1500 rpm to consider the over-speeding of the runaway. Over-speeding causes very significant mechanical stress, and the minimum speed limited to 600 rpm, as because below this speed, the volume of the generator, hence its price compared to the installed power, increases with a decline in yield due to increased losses. When the rotational speed of the turbine is less than 600 rpm, it usually drives a generator with a low number of poles (1000 or 1500 rpm) via a speed increaser.
Thus, after calculating the specific speed of a hydro-project, the appropriate type of turbine can be selected through the Table 3, which describes the operating speed limits by turbine.
This way of characterizing turbines through the specific speed was even used in the numerical model of Yildiz and Vrugt (2019).
Generally, in the prefeasibility study phase, the head and the design flow rate are used to select the appropriate type of turbine for a project since usually there is no enough information to calculate the specific speed. The choice of the methodology for selecting the type of turbine requires this level of information.
Cavitation model
The cavitation phenomenon occurs when a high-enough negative pressure occurs at the exit of the wheel, such as when a reaction turbine is located well above the downstream plan. In those conditions, water vaporizes and the corresponding vapor bubbles first detach from the surface of the runner blade and then implode creating strong pressure waves as soon as they reach an area where pressure is higher. As these implosions cause fast erosion of the blades, they must be avoided by accurately design the turbine discharge to limit the depression at its exit. To do so, the so-called suction head HS, which measures the distance between the downstream plan of water and the axis of the wheel of the turbine, shall be limited.
To reduce the construction costs, a reaction turbine shall be placed as high as possible in reference to the downstream level, but this increases the value of HS and cavitation may occur. Therefore, to protect turbines, it is important to know the suction head threshold beyond which cavitation appears relevant enough to damage the wheel during the implantation of a turbine. In mathematical terms, HS is calculated as follows (Penche, 2004):
where \({H}_{\text{s}}\)(m) is the limited suction head, \({H}_{\text{a}}\)(m) is the water height equivalent to atmospheric pressure, Hv (m) is the water height equivalent to the vaporization pressure, H (m) is the net head, V (m/s2) is the outlet average velocity (as a first approach, one can consider 2 m/s according to ESHA (Penche, 2004)) and σ is a dimensionless coefficient called the Thomas’s coefficient.
\({H}_{\text{a}}\) can be calculated with the formula below (Yildiz & Vrugt, 2019):
where \({P}_{0}\) is the atmospheric pressure in Pa at sea level and \(z\) is the altitude of the power house in m.
\(\sigma\) can be calculated with the equations below (Penche, 2004):
where V is the outlet average velocity in m/s2 and H the net head in m.
In the techno-economical method for sizing the capacity of a small hydropower plant by Santolin et al. (2011), the limited suction head was also calculated with the equation above but with different equations for the calculation of the Thomas’s coefficient: \(\sigma\) was calculated with the equations below:
with
where \({\omega }_{\text{s}}\) is the dimensionless specific speed (with values lying in the intervals [0.04, 0.40] for Pelton turbines, [0.4, 1] for Slow Francis turbines, (Safarian et al., 2019; Yildiz & Vrugt, 2019) for Normal Francis turbines, [2.0, 2.5] for Quick Francis turbines and [2.5, 8.0] for Kaplan turbines) and \(\omega\) the rotation velocity in rad/s.
Turbine operation models
It is worth noticing that each turbine can only operate between a minimum and a maximum flow rate, reflecting its limit in exploiting the available hydraulic energy. Hence, in a hydropower plant where there is only one turbine, the power output of the turbine can be represented as follows (Anagnostopoulos & Papantonis, 2007; HOMER, 2019):
\({Q}_{\text{exploited}}\): Exploited discharge (m3/s).
\({Q}_{\text{exploitable}}\): Exploitable discharge (m3/s).
Qmin: Minimal discharge (m3/s).
Qmiax: Maximal discharge (m3/s).
The minimal discharge is usually given as a percentage of the rated discharge (Penche, 2004), whose values by turbine type are reviewed and summarized in Table 4.
Hanggi and Weingartner (2012) proposed a new parameter \(Q_{{{\text{safety}}}}\), which is the safety flow beyond which the turbine operation has to be to avoid damages. By taking into account this new security constraint, the new operating schedule below emerged: (Yildiz & Vrugt, 2019):
Hanggi and Weingartner (2012) recommended to set \(Q_{{{\text{safety}}}}\) equal to the river discharge with an exceedance probability of 2% and it was done by Yildiz and Vrugt (2019) in their work.
It is worth mentioning that in most hydro-projects, environmental regulation mandates a minimum non-usable to bypass the hydropower plant to limit damages to the ecosystem. There are several hydrological-based environmental flows methods, which allow estimating this minimum flow. According to Kuriqi et al. (2019), the choice of 10% or 15% daily flow as minimum flow, methods named 10% or 15% Daily Flow, is considered appropriate. One of the methods can be used as reference method and can be combined with other methods.
Accordingly, the exploitable flow is obtained by the equation:
where \(Q\)Exploitable: Exploitable flow (m3/s).
\(Q\)river: Flow of the river (m3/s).
Qf: Reserved flow (m3/s).
However, given the variability of the river flow across the year and the operating schedules above, the efficient exploitation of a hydraulic resource, particularly in run-of-river plants with one turbine, can be challenging. For this reason, multiple turbines of different size operated in parallel may be used to enhance overall exploitation of the potential energy, but project, operation and maintenance costs may rise. This financial constraint limits most models to two turbines in practical terms (Anagnostopoulos & Papantonis, 2004, 2007).
While dealing with two turbines, the operating schedule is a bit more complex. Two examples of operating schedule in the case of two turbines of different size working in parallel have been seen in the literature.
The first example is the methodology of Anagnostopoulos and Papantonis (2007) that does not consider the parameter \({Q}_{\text{safety}}\), conversely to the second example of Yildiz and Vrugt (2019).
Calculation model of the energy production
The electric power generated by each turbine can be calculated using the formula below (RETScreen International, 2001):
With
where D: diameter of the penstock (m), \(L\)\(:\) Penstock length (m), \(:\) friction factor from moody chart of Darcy’s equation (–),\(V\)\(:\) velocity of water at the time t (m/s),\(\Delta H_{{{\text{major}}}}\): losses due to friction (m), \(\Delta H_{{{\text{minor}}}}\): singular or local losses (m),\(\varepsilon\): coefficient of singular loss (–), Pelec\(:\) electric power the time t (kW),\(\rho\): density of water (kg/m3),\(g\)\(:\) gravitational acceleration (m/s2), Qt,k: exploited discharge of the turbine number k at the time t (m3/s), \(h_{{{\text{net}}}}\)\(:\)Net head (m)\(,\): gross head (m)\(,\): efficiency of the turbine number k at the time t (%)\(, :\) efficiency of the generator (%),\(l_{{{\text{trans}}}}\)\(:\) the transformer losses (–)\(,:\) line losses (–).
The calculation of turbine efficiencies can be done with the efficiency equations presented in the Retscreen engineering and cases textbook (RETScreen International, 2001) which are derived from a large number of manufacture efficiency curves for different turbine types and head and flow conditions. Gagliano et al. (2014) to evaluate the technical feasibility of repowering an old Silican hydro-power plant also used this equation for the calculation of electric power by a turbine. The results of the simulation were sufficiently reliable.
The amount of energy E in kilowatt hours (kWh) produced by n turbines of a run-of-river hydropower plant over a time period \(\Delta\)t can be calculated using the formula below
Equation (43) is one of the most general energy calculation formulae identified in the literature since it takes into account not only the electrical losses of all equipment (turbine, alternator, transformer), but also all types of line losses, such as those due to a parasitic load or an inappropriate cable section. The efficiency of the increaser should also be considered when it is needed between the turbine and the generator. Although the evolution of the generator efficiency with load is not considered in this equation, it generally gives a good representation of the total energy production, when the average efficiency is considered (Yildiz & Vrugt, 2019).
It is important to note that in grid-connected applications, all the potential energy that the hydro-power plant can generate is usually sold, unless grid outages occur. Instead, in off-grid applications depending on the actual load, the hydro-power plant may not be exploited completely and renewable production may be curtailed. This article focuses on the generation system, which can then be connected to the grid or enable a mini-grid or off-grid system. However, the issue of distribution of the generated energy is not discussed in this article.
There are also three indices, namely the energy production index \({E}_{f}\), the load index \({L}_{f}\) and the water exploitation index \({W}_{f}\), which can be useful for the assessment of the efficiency of a hydropower plant.\({W}_{f}\) denotes the fraction of the stream flow that passes through the operating turbines, \({E}_{f}\) is the sum of the generated energy divided by the energy potential of the natural stream at a gross head during a year period and \({L}_{f}\) is the ratio of the mean (annually) produced power to the installed nominal power (Anagnostopoulos & Papantonis, 2004, 2007).
Cost estimation models of small hydropower projects
While dealing with a small hydropower project, it is important to evaluate its financial viability along with technical feasibility before taking any investment decision. That is the reason why several researchers developed multiple models for the estimation of the cost of a small hydropower project defining different cost-influencing parameters, which represent the variables of the equations. The most common cost-influencing parameters are the power and the net head.
Singal and Saini (2007) made an analysis for the cost of canal-based small hydropower schemes in the plains and other regions of the country in which water is used also for other purposes, like irrigation/drinking through canals, small dams, etc., and developed the correlation in Eq. (43) for estimating the cost of such schemes. The results of the correlation showed a maximum deviation of ± 12%, so the correlation can be used to predict the cost of a small hydropower plant at the planning stage.
Another study carried out by Singal et al. (2008) on the cost optimization based on electromechanical equipment of canal-based low-head (3–20 m) small hydropower scheme proposed correlations for the cost in Indian Rupees per kilowatt of the main components. These main components include civil works (diversion channel, spillway and power house building) and electromechanical equipment (turbine with governing system, generator with excitation system, control and protection equipment, electrical and mechanical auxiliaries, and main transformer and switchyard equipment). The correlations are presented below:
\(\text{Cost of diversion channel}\): \(C_{1} = a_{1} P^{{x_{1} }} H^{{y_{1} }}\)(45)
\(\text{Cost of spillway}\): \(C_{2} = a_{2} P^{{x_{2} }} H^{{y_{2} }}\)(46)
\(\text{Cost of power house building}\): \(C_{3} = a_{3} P^{{x_{3} }} H^{{y_{3} }}\)(47)
\(\text{Cost of turbines with governing system}\): \(C_{4} = a_{4} P^{{x_{4} }} H^{{y_{4} }}\)(48)
\(\text{Cost of generator with excitation system}\): \(C_{5} = a_{5} P^{{x_{5} }} H^{{y_{5} }}\)(49)
\(\text{Cost of electrical }\&\text{ mechanical auxiliaries}\): \(C_{6} = a_{6} P^{{x_{6} }} H^{{y_{6} }}\)(50)
\(\text{Cost of transformer }\&\text{ switchyard equipment}\): \(C_{7} = a_{7} P^{{x_{7} }} H^{{y_{7} }}\) (51)
with \({a}_{1}=9904, {x}_{1}=-0.2295, {y}_{1}=-0.0623\)
\({a}_{3}\), \({x}_{3}\), and \({y}_{3}\) can be obtained via Table 5 and the other coefficients via Table 6.
The total project cost includes the cost of civil works, the direct cost of electromechanical equipment and various items, and other indirect costs. This miscellaneous and indirect cost (that includes the costs of designs, indirect costs, tools and plants, communication, preliminary charge of preparing the report, survey and investigation, environmental impact assessment and cost of land) represents 13% of the sum of the cost of civil works and electromechanical equipment. Thus, the total cost of the project in this case can be calculated through the equation below:
In the work of Singal et al. (2010) on the analysis for cost estimation of low-head (3–20 m) run-of-river small hydropower schemes, other correlations were proposed for estimating the costs of several subcomponents of civil works. This includes diversion weir and intake, desilting chamber, power channel including head race channel, forebay and spillway, penstock, powerhouse building and tail race channel and electromechanical equipment (turbine with governing system, generator with excitation system, control and protection equipment, electrical and mechanical auxiliaries, main transformer and switchyard equipment). The correlations are presented below:
\(\text{Cost of power house building}\): \(C_{1} = 92615P^{ - 0.2351} H^{ - 0.0585}\)(55)
\(\text{Cost of diversion weir and intake}\): \(C_{2} = 12415P^{ - 0.2368} H^{ - 0.0597}\)(56)
\(\text{Cost of power channel}\): \(C_{3} = 85383P^{ - 0.3811} H^{ - 0.0307}\)(57)
\(\text{Cost of desilting chamber}\): \(C_{4} = 20700P^{ - 0.2385} H^{ - 0.0611}\)(58)
\(\text{Cost of forebay and spillway}\): \(C_{5} = 25402P^{ - 0.2356} H^{ - 0.0589}\)(59)
\(\text{Cost of penstock}\): \(C_{6} = 7875P^{ - 0.3806} H^{ - 0.3804}\)(60)
\(\text{Cost of tail race channel}\): \(C_{7} = 28164P^{ - 0.376} H^{ - 0.624}\)(61)
Finally, the cost in Indian Rupees per kilowatt of civil works is
\(\text{Cost of turbines with governing system}\):
\(\text{Cost of generator with excitation system}\):
\(\text{Cost of electrical }\&\text{ mechanical auxiliaries}:\)
\(\text{Cost of transformer }\&\text{ switchyard equipment}\):
Finally, the cost in Indian Rupees per kilowatt of electromechanical equipment is
For the same reasons mentioned in the work of Singal et al. (2008), the total cost of the project in this case too will be calculated through the Eq. (53).
Ogayar and Vidal (2009) developed correlations to estimate the cost of the electromechanical equipment (turbine, alternator and regulator) based on the head and the power. Here, we have an equation for each type of turbine: Pelton, Francis, Kaplan and semi-Kaplan for a power range below 2 MW. The results of these equations can be used to determine the initial investment at a previous study level when planning refurbishment or new construction of small hydropower plants without developing a complete project. These equations had been validated with real installations in different countries of the world (Spain, France, Italy, Belgium, Portugal, and Morocco) with committed errors lower than 20%. Santolin et al. (2011) used these equations in their techno-economical method for capacity sizing of a small hydropower plant to determine the machine cost. They were even updated by Gallagher et al. (2015) in his four-step methodology for assessing potential energy recovery sites in water and wastewater infrastructure in the UK and Ireland.
The correlations obtained were:
-
\(COST = 17.693P^{( - 0.3644725)} H^{( - 0.281735)}\) (68) in €/kW for Pelton turbine with errors ranged between − 23.83% and 20.015% ( R2 = 93.16%);
-
\(COST = 25.698P^{( - 0.560135)} H^{( - 0.127243)}\)(69) in €/kW for Francis turbine with errors ranged between − 15.83% and 22.27% (R2 = 72.26%);
-
\(COST = 33.236P^{( - 0.58338)} H^{( - 0.113901)}\) (70) in €/kW for Kaplan turbine with errors ranged between − 18.53% and 23.5% (R2 = 91.7%);
-
\(COST = 19.498P^{( - 0.58338)} H^{( - 0.113901)}\) (71) in €/kW for Semi-Kaplan turbine with errors ranged between − 18.53% and 23.5% (R2 = 91.72%).
Mishra et al. (2011a) also developed correlations for the estimation of the cost of the electromechanical equipment (turbine-alternator) in run-of-river small hydropower projects based on the head and the power. They used three different methods: sigma plot method, linest method and logest method. The results obtained from these correlations were verified from the data of electro-mechanical equipment of installed small hydropower projects. The results of the sigma plot software had a maximum error of ± 10%, the ones of the linest method had a maximum error of ± 5% and the ones of the logest method had a maximum error of ± 18%. Therefore, they are regarded as suitable for the preliminary cost estimation of the electromechanical equipment in small run-of-river hydropower projects.
(Sigma plot method)
(Linest method)
(Logest method)
In the review of Mishra et al. (2012) on electromechanical equipment applicable to small hydropower plants, other correlations developed for the cost of run-of-river small hydropower projects under low head (3–20 m) considering the head and the power were presented. Here, there is an equation for the cost estimation of turbines with governing system \(( {C}_{\text{t}}\)), an equation for the cost estimation of generators with excitation system \(( {C}_{\text{g}}\)), an equation for the cost estimation of electrical and mechanical auxiliaries \(( {C}_{\text{e}}\)) and another one for the estimation of the cost of transformers and switchyard equipment \(( {C}_{\text{tr}}\)). The equations are presented below:
where \({C}_{\text{e}\&\text{m}}\) is the cost per kilowatt of electromechanical equipment, H the net head in m and P the power in kW.
Mishra et al. (2011b) proposed other correlations for the estimation of the investment cost of an entire small hydropower scheme under low head plants. There were formulas for civil works and formulas for electromechanical equipment.
For civil works, we have:
-
Intake (C1): \(14382P^{( - 0.2368)} H^{( - 0.0596)}\)(76) with one unit, \(17940P^{( - 0.2366)} H^{( - 0.0596)}\)(77) with two units, \(21191P^{( - 0.2367)} H^{( - 0.0597)}\) (78) with three units and \(24164P^{( - 0.2371)} H^{( - 0.06)}\) (79) with four units;
-
Penstock (C2): \(4906P^{( - 0.3722)} H^{( - 0.3866)}\)(80) with one unit, \(7875P^{( - 0.3806)} H^{( - 0.3804)}\) (81) with two units, \(9001P^{( - 0.369)} H^{( - 0.389)}\) (82) with three units and \(10649P^{( - 0.3669)} H^{( - 0.3905)}\) (83) with four units;
-
Power house building (C3): \(62246P^{( - 0.2354)} H^{( - 0.0587)}\)(84) with one unit, \(92615P^{( - 0.2351)} H^{( - 0.0585)}\)(85) with two units, \(121027P^{( - 0.2354)} H^{( - 0.0587)}\) (86) with three units and \(146311P^{( - 0.2357)} H^{( - 0.0589)}\)(87) with four units;
-
Tailrace channel (C4): \(28164P^{( - 0.376)} H^{( - 0.624)}\)(88) with one unit, \(28164P^{( - 0.376)} H^{( - 0.624)}\)(89) with two units, \(28164P^{( - 0.376)} H^{( - 0.624)}\)(90) with three units and \(28164P^{( - 0.376)} H^{( - 0.624)}\) (91) with four units.
For electromechanical equipment, we have:
-
Turbine with governing system (C5): \(39485P^{( - 0.1902)} H^{( - 0.2167)}\)(92) with one unit, \(63346P^{( - 0.1913)} H^{( - 0.217)}\) (92) with two units, \(83464P^{( - 0.1922)} H^{( - 0.2178)}\) (93) with three units and \(101464P^{( - 0.1920)} H^{( - 0.2177)}\)(94) with four units;
-
Generator with excitation system (C6): \(48568P^{( - 0.1867)} H^{( - 0.2090)}\) (95) with one unit, \(78661P^{( - 0.1855)} H^{( - 0.2090)}\)(96) with two units, \(105046P^{( - 0.1859)} H^{( - 0.2085)}\)(97) with three units and \(127038P^{( - 0.1858)} H^{( - 0.2085)}\)(98) with four units;
-
Mechanical and electrical auxiliaries (C7): \(31712P^{( - 0.1900)} H^{( - 0.2122)}\) (99) with one unit, \(40860P^{( - 0.1892)} H^{( - 0.2118)}\)(100) with two units, \(49338P^{( - 0.1898)} H^{( - 0.2080)}\) (101) with three units and \(56625P^{( - 0.1896)} H^{( - 0.2121)}\)(102) with four units;
-
Main transformer and switchyard equipment (C8): \(14062P^{( - 0.1817)} H^{( - 0.2082)}\)(103) with one unit, \(18739P^{( - 0.1803)} H^{( - 0.2075)}\)(104) with two units, \(23051P^{( - 0.1811)} H^{( - 0.2080)}\)(105) with three units and \(26398P^{( - 0.1809)} H^{( - 0.2079)}\)(106) with four units.
Thus, the formula to calculate the total cost per kW (Rs) is \({\mathbf{1}}.{\mathbf{13}}(C_{1} + \, C_{2} + \, C_{3} + \, C_{4} + C_{5} + \, C_{6} + \, C_{7} + \, C_{8} )\) (107).
Yildiz and Vrugt (2019) computed the cost of electromechanical equipment (turbine, generator and power transformer) using the equation of Ogayar and Vidal (2009):
where j is the exchange rate of euro to US dollar, P is the installed capacity of the plant in MW, a, b and c are coefficients of calculation depending on the type of turbine used. The multiplication factor 1/1000 converts the units of P from MW to kW. The cost of the penstock was calculated with the equation below:
where \(D\), \(k\) and \(L\) are the diameter, the thickness and the length of the penstock in units of meters, \({d}_{s}\) in ton/m3 denotes the steel density and \({c}_{\text{ton}}\) in $/ton is the penstock cost per ton weight.
The total cost of civil works was calculated with the Eq. 110 below:
where \(\alpha\) is a unitless coefficient called site factor (it can take on values between 0 and 1.5). The yearly maintenance and operation cost \({C}_{\text{om}}\) are estimated using the expression \({C}_{\text{om}}={\beta C}_{\text{em}}\) with \(\beta\) a unitless coefficient whose value ranges between 0.01 and 0.04. It was considered here that the electromechanical equipment has a life-span of about 25 years and the plant has a lifespan of 50 years. Hence, the total monetary investment in this numerical model is estimated using Eq. 111 below:
Dubas and Pigueron (2009) established a formula given the price, dated September 2009, of electromechanical equipment (the guard valve, the turbine, the generator as well as control-command, safety devices and cabinets) based on series of invoices and offers for this equipment. The formula relies on the maximum hydraulic power as presented in Eq. (112):
While using this formula, if the price obtained is lower than 20′000 CHF, then 20′000 CHF should be considered as the price. However, this price may vary from single to double depending on the supplier. In addition, this price was related to the specific economic and market situation of that time: when mini-turbines are in great demand, or when the prices of steel or copper prices are high, such as in recent periods, prices increase, making it difficult to be precise.
More recently, Mishra et al. (2018) developed a methodology for cost assessment of high head (beyond 100 m) run-of-river small hydropower plant projects to determine their techno-economic viability before undergoing detailed investigation. In this work, it is still the capacity and the head that have been considered as cost-influencing parameters. The correlations for cost proposed in this study were based on different types of head race conduit, penstock materials, types of turbine and types of generator for various layouts. It was concluded that these correlations could be used for reasonable cost estimation of hydropower projects for planning of such projects. The costs obtained through these correlations are in Indian Rupees. The correlations of costs are presented in Eqs. 113 and 114:
-
Cost per kilowatt of civil works
$${C}_{x}=1.06\times \left(\frac{E}{W}\times \text{cost of earth work in excavation}\right)+\left(\text{Conc}.\times \text{cost of Concreting}\right)+\left(RS\times \text{cost of Reinforced steel}\right)+(SS\times c\text{ost of Structural Steel}/\text{Material}$$(113)$$C_{{\text{C}}} = C_{{\text{W}}} + C_{{{\text{IC}}}} + C_{{{\text{DT}}}} + C_{{{\text{HRC}}}} + C_{{{\text{FS}}}} + C_{{\text{P}}} + C_{{{\text{PH}}}} + C_{{{\text{TRC}}}}$$(114)
The equations for the calculation of costs of civil works components presented above are used with Table 7 and considering the prices as per schedule of rates prevailing for the year 2012 in India (Penche, 2004). Thus, the prices used are as follows:
-
The price for earthwork in excavation with all leads and lifts in ordinary soil is 265 Indian Rupee/m3;
-
The price for earthwork in excavation with all leads and lifts in soft rock, where blasting is not required is 330 Indian Rupee/m3;
-
The price for earthwork in excavation with all leads and lifts in hard rock, including blasting is 550 Indian Rupee/m3;
-
The price for M20 grade concrete work in plain cement concrete as well as in reinforced cement concrete, including shuttering, mixing, placing in position, compacting, and curing is 3640 Indian Rupee/m3;
-
The price for reinforcement steel bars of iron 500 grade, including cutting, bending, binding, and placing in position is 55,000 Indian Rupee/MT;
-
The price for structural steel, including fabrication, transportation to site, and erection is 75,000 Indian Rupee/MT.
-
Cost per kilowatt of electromechanical equipment
$$C_{y} = a_{1} P^{{x_{1} }} H^{{x_{2} }}$$(114)$$C_{{{{e\& m}}}} = C_{{{\text{TG}}}} + C_{{{\text{GE}}}} + C_{{{\text{Aux}}}} + C_{T/F} + C_{{{\text{SY}}}}$$(115)
The electromechanical equipment considered and the value of the constants \({a}_{1}\), \({x}_{1}\) and \({x}_{2}\) are presented in Table 8.
Total cost
For the same reasons mentioned in the work of Singal et al. (2008), the total cost of a high head run-of-river small hydropower plant project can be calculated through Eq. (53).
These equations for the estimation of the cost of small hydropower projects presented in this part should be used carefully because they give a rough estimation of the costs of specific markets at specific times.
Conclusion and future scope
This paper presents a detailed review of models for the techno-economic design of a run-of-river hydropower plants. In particular, the technical modeling of the diameter and thickness of a penstock, the optimal selection and implantation (admissible suction head) of the turbine, the estimation of energy production systems and the estimation of the cost of small hydropower projects were extensively reviewed and discussed. These modeling approaches provide a powerful tool for the technical, economical, and financial feasibility study of run-of-river hydropower sites, to feed Artificial Intelligence and optimization algorithms. The limitation and validity of each have been clarified to inform readers on the generalizability of the study, as technology and market conditions evolve.
Therefore, this study can be of interest for scholars and developers interested in developing run-of-river feasibility studies and further research activity, especially in the context of Sub-Saharan Africa. The results of this review could also be used to develop a tool for the preliminary studies of run-of-river hydropower projects.
Availability of data and materials
All data analyzed during this study are included in this published article.
References
Acakpovi, A., Ben Hagan, E., & Xavier Fifatin, F. (2014). Review of hydropower plant models. International Journal of Computer Applications, 108(18), 33–38. https://doi.org/10.5120/19014-0541
Adejumobi, I., & Shobayo, D. (2015). Optimal selection of hydraulic turbines for small hydro electric power generation—A case study of Opeki River, South Western Nigeria. Nigerian Journal of Technology, 34(3), 530. https://doi.org/10.4314/njt.v34i3.15
Alexander, K. V., & Giddens, E. P. (2008). Optimum penstocks for low head microhydro schemes. Renewable Energy, 33(3), 507–519. https://doi.org/10.1016/j.renene.2007.01.009
Anagnostopoulos, J., & Papantonis, D. E. (2004). Application of evolutionary algorithms for the optimal design of a small hydroelectric power plant. Conference HYDRO 2004: A new era for hydropower.
Anagnostopoulos, J. S., & Papantonis, D. E. (2007). Optimal sizing of a run-of-river small hydropower plant. Energy Convers. Manag., 48(10), 2663–2670. https://doi.org/10.1016/j.enconman.2007.04.016
Aquaret, Run-of-River. (2012). http://www.aquaret.com/indexa224.html?option=com_content&view=article&id=88&Itemid=233&lang=en. Accessed 13 Feb 2020.
Bezabih, A. W. (2021). Evaluation of small hydropower plant at Ribb irrigation dam in Amhara regional state, Ethiopia. Environmental Systems Research. https://doi.org/10.1186/s40068-020-00196-z
Bhat, V. I. K., & Prakash, R. (2014). Life cycle analysis of run-of river small hydro power plants in India. Open Renewable Energy Journal, 1(1), 11–16. https://doi.org/10.2174/1876387100901010011
Bozorg Haddad, O., Moradi-Jalal, M., & Marino, M. A. (2011). Design-operation optimisation of run-of-river power plants. Water Management, 164(9), 463–475.
Breeze, P. A. (2005). Power generation technologies. Elsevier; Newnes.
Casila, J. C., Duka, M., De Los Reyes, R., & Ureta, J. C. (2019). Potential of the Molawin creek for micro hydro power generation: An assessment. Sustainable Energy Technologies and Assessments., 32, 111–120. https://doi.org/10.1016/j.seta.2019.02.005
Chapallaz, J. M., Mombelli, H. P., & Renaud, A. (1995). Turbines hydrauliques journées de formation pour ingénieurs : petites centrales hydrauliques. Brochure of Journées de formation pour ingénieurs, Programme d’action PACER–Energies renouvelables. Office fédéral des questions conjoncturelles, Lausanne, p. 130.
Dubas, M., & Pigueron, Y. (2009). Guide pour l’étude sommaire de petites centrales hydrauliques, manuel de cours. Haute Ecole Spécialisée de Suisse Occidentale (HES-SO), ed 1.
Edeoja, A., Ibrahim, J., & Kucha, E. (2016). Investigation of the effect of Penstock configuration on the performance of a simplified pico-hydro system. British Journal of Applied Science and Technology, 14(5), 1–11. https://doi.org/10.9734/bjast/2016/23996
Elbatran, A. H., Abdel-Hamed, M. W., Yaakob, O. B., Ahmed, Y. M., & Arif Ismail, M. (2015). Hydro power and turbine systems reviews. Jurnal Teknologi, 74(5), 83–90. https://doi.org/10.11113/jt.v74.4646
Fraenkel, P., Paish, O., Harvey, A., Brown, R., Edwards, A., & Bokalders V. (1999). Micro-hydro power: A guide for development workers. Intermed. Technol. Publ., no. June, p. 150.
Gagliano, A., Tina, G. M., Nocera, F., & Patania, F. (2014). Technical and economic perspective for repowering of micro hydro power plants: A case study of an early XX century power plant. Energy Procedia, 62, 512–521. https://doi.org/10.1016/j.egypro.2014.12.413
Gallagher, J., Harris, I. M., Packwood, A. J., McNabola, A., & Williams, A. P. (2015). A strategic assessment of micro-hydropower in the UK and Irish water industry: Identifying technical and economic constraints. Renewable Energy, 81, 808–815. https://doi.org/10.1016/j.renene.2015.03.078
Ghosh, T. K., & Prelas, M. A. (2011). Energy resources and systems: Volume 2: Renewable resources. Springer Netherlands. https://doi.org/10.1007/978-94-007-1402-1
Goodland, R. (1994). Environmental sustainability and the power sector. Impact Assessment, 12(4), 409–470. https://doi.org/10.1080/07349165.1994.9725877
Hänggi, P., & Weingartner, R. (2012). Variations in discharge volumes for hydropower generation in Switzerland. Water Resources Management, 26(5), 1231–1252. https://doi.org/10.1007/s11269-011-9956-1
Héteu, P. T., & Martin, J. (2003). La filière hydroélectrique : Aspects technologiques et environnementaux. UCL-GEB, Louvain, Prix Tractebel 2001, working paper n°5.
Hoesein, A. A., & Montarcih, L. (2011). Design of micro hydro electrical power at Brang Rea River in West Sumbawa of Indonesia. Journal of Applied Technology in Environmental Sanitation., 1(2), 177–183.
HOMER, Hydro Turbine Flow Rate; https://www.homerenergy.com/products/pro/docs/latest. Accessed 02 Oct 2019.
Hydropower status report, sector trends and insights. (2019). www.hydropower.org. Accessed 15 Mar 2020.
Ibrahim, M., Imam, Y., & Ghanem, A. (2019). Optimal planning and design of run-of-river hydroelectric power projects. Renewable Energy, 141, 858–873. https://doi.org/10.1016/j.renene.2019.04.009
Jadoon, T. R., Khurram Ali, M., Hussain, S., Wasim, A., & Jahanzaib, M. (2020). Sustaining power production in hydropower stations of developing countries. Sustainable Energy Technologies and Assessments, 37, 1–16. https://doi.org/10.1016/j.seta.2020.100637
Kengne Signe, E. B., Hamandjoda, O., & Nganhou, J. (2017a). Methodology of feasibility studies of micro-hydro power plants in Cameroon: Case of the micro-hydro of KEMKEN. Energy Procedia, 119, 17–28. https://doi.org/10.1016/j.egypro.2017.07.042
Kengne Signe, E. B., Hamandjoda, O., Nganhou, J., & Wegang, L. (2017b). Technical and economic feasibility studies of a micro hydropower plant in Cameroon for a sustainable development. Journal of Power Energy Engineering, 05(09), 64–73. https://doi.org/10.4236/jpee.2017.59006
Kishore, T. S., Patro, E. R., Harish, V. S. K. V., & Haghighi, A. T. (2021). A comprehensive study on the recent progress and trends in development of small hydropower projects. Energies, 14(10), 2882. https://doi.org/10.3390/en14102882
Korkovelos, A., Mentis, D., Siyal, S. H., Arderne R. H., Bazilian, M., Howells, M., Beck, H., & Roo, A. D. (2018). A geospatial assessment of small-scale hydropower potential in sub-Saharan Africa. Energies. https://doi.org/10.3390/en11113100
Kumar, D., & Katoch, S. S. (2014). Sustainability indicators for run of the river (RoR) hydropower projects in hydro rich regions of India. Renewable and Sustainable Energy Reviews, 35, 101–108. https://doi.org/10.1016/j.rser.2014.03.048
Kuriqi, A., Pinheiro, A. N., Sordo-Ward, A., Bejarano, M. D., & Garrote, L. (2021). Ecological impacts of run-of-river hydropower plants—Current status and future prospects on the brink of energy transition. Renewable and Sustainable Energy Reviews. https://doi.org/10.1016/j.rser.2021.110833
Kuriqi, A., Pinheiro, A. N., Sordo-Ward, A., & Garrote, L. (2019). Influence of hydrologically based environmental flow methods on flow alteration and energy production in a run-of-river hydropower plant. Journal of Cleaner Production, 232, 1028–1042. https://doi.org/10.1016/j.jclepro.2019.05.358
Malhan, P., & Mittal, M. (2021). Evaluation of different statistical techniques for developing cost correlations of micro hydro power plants. Sustainable Energy Technologies and Assessments, 43, 1–9. https://doi.org/10.1016/j.seta.2020.100904
Mishra, S., Singal, S. K., & Khatod, D. K. (2011a). Approach for cost determination of electro-mechanical equipment in Ror projects. Smart Grid and Renewable Energy, 02(2), 63–67. https://doi.org/10.4236/sgre.2011.22008
Mishra, S., Singal, S. K., & Khatod, D. K. (2011b). Optimal installation of small hydropower plant—A review. Renewable and Sustainable Energy Reviews, 15(8), 3862–3869. https://doi.org/10.1016/j.rser.2011.07.008
Mishra, S., Singal, S. K., & Khatod, D. K. (2012). A review on electromechanical equipment applicable to small hydropower plants. International Journal of Energy Research, 36(5), 553–571. https://doi.org/10.1002/er.1955
Mishra, S., Singal, S. K., & Khatod, D. K. (2018). Cost optimization of high head run of river small hydropower projects. In M. Majumder (Ed.), Application of geographical information systems and soft computation techniques in water and water based renewable energy problems (pp. 141–166). Springer. https://doi.org/10.1007/978-981-10-6205-6_7
Mohsin Munir, M., Shakir, A. S., & Khan, N. M. (2015). Optimal sizing of low head hydropower plant—A case study of hydropower project at head of UCC (Lower) at Bambanwala. Journal of Engineering and Applied Science, 16, 73–83.
Nasir, B. A. (2014). Design considerations of micro-hydro-electric power plant. Energy Procedia, 50, 19–29. https://doi.org/10.1016/j.egypro.2014.06.003
Obinna Ajala Chinyere, N. R. O., & Emmanuel Osiewundo Ojo Chidozie Okonkwo, E. U. M. (2017). Technical details for the design of a Penstock for Kuchigoro small hydro project. American Journal of Renewable Sustainable Energy, 3(4), 27–35.
Ogayar, B., & Vidal, P. G. (2009). Cost determination of the electro-mechanical equipment of a small hydro-power plant. Renewable Energy, 34(1), 6–13. https://doi.org/10.1016/j.renene.2008.04.039
Ohunakin, O. S., Ojolo, S. J., & Ajayi, O. O. (2011). Small hydropower (SHP) development in Nigeria: An assessment. Renewable and Sustainable Energy Reviews, 15(4), 2006–2013. https://doi.org/10.1016/j.rser.2011.01.003
Okedu, K. E., Uhunmwangho, R., & Odje, M. (2020). Harnessing the potential of small hydro power in Cross River state of Southern Nigeria. Sustainable Energy Technologies and Assessments, 37, 1–11. https://doi.org/10.1016/j.seta.2019.100617
Okibe Edeoja, A., Ibrahim, S. J., & Kucha, E. I. (2015). Conceptual design of a simplified decentralized pico hydropower with provision for recycling water. Journal of Multidisciplinary Engineering Science and Technology, 2(2), 3159–3199.
Okot, D. K. (2013). Review of small hydropower technology. Renewable and Sustainable Energy Reviews, 26, 515–520. https://doi.org/10.1016/j.rser.2013.05.006
Pagès, J. M., Supparo, E., Lafage, B., Etienne, J., & Valet, T. (2003). Guide pour le montage de projets de petite hydroélectricité—CONNAÎTRE POUR AGIR—Guides et cahier s techniques. Agence de l’Environnement et de la Maitrise de l’Energie (ADEME), p. 159, Ed. Rouland.
Paish, O. (2002). Small hydro power: Technology and current status. Renewable and Sustainable Energy Reviews, 6(6), 537–556. https://doi.org/10.1016/S1364-0321(02)00006-0
Penche, C. (2004). Guide on how to develop a small hydropower plant. European Small Hydropower Association—ESHA, p. 296.
Publishers, E. (2015). Run-of-river hydropower systems. www.ee.co.za/article/run-of-river-hydropower-systems.html. Accessed 9 Feb 2020.
Punys, P., Dumbrauskas, A., Kvaraciejus, A., & Vyciene, G. (2011). Tools for small hydropower plant resource planning and development: A review of technology and applications. Energies, 4(9), 1258–1277. https://doi.org/10.3390/en4091258
Ramos, H., Betâmio De Almeida, A., Manuela Portela, M., & Pires De Almeida, H. (2000). Guideline for design of small hydropower plants, Western Regional Energy Agency & Network, 2000.
RETScreen International. (2001). Engineering-Cases-Textbook, Clean Energy Project Analysis, 2001–2004.
Safarian, S., Unnthorsson, R., & Ritcher, C. (2019). A review of biomass gasifcation modelling. Renewable and Sustainable Energy Reviews, 110, 378–391. https://doi.org/10.1016/j.rser.2019.05.003
Safdar, I., Sultan, S., Raza, H. A., Umer, M., & Ali, M. (2020). Empirical analysis of turbine and generator efficiency of a Pico hydro system. Sustainable Energy Technologies and Assessments, 37, 1–7. https://doi.org/10.1016/j.seta.2019.100605
Sangal, S., Garg, A., & Kumar, D. (2013). Review of optimal selection of turbines for hydroelectric projects. International Journal of Emerging Technolology and Advanced Engineering, 3(3), 424–430.
Santolin, A., Cavazzini, G., Pavesi, G., Ardizzon, G., & Rossetti, A. (2011). Techno-economical method for the capacity sizing of a small hydropower plant. Energy Conversion Management., 52(7), 2533–2541. https://doi.org/10.1016/j.enconman.2011.01.001
Sasthav, C., & Oladosu, G. (2022). Environmental design of low-head run-of-river hydropower in the United States: A review of facility design models. Renewable and Sustainable Energy Reviews. https://doi.org/10.1016/j.rser.2022.112312
Sattouf, M. (2014). Simulation model of hydro power plant using Matlab/Simulink. International Journal of Engineering Research and Applications, 4(1), 295–301.
Singal, S. K., & Saini, R. P. (2007). Analytical approach for cost estimation of low head small hydro power schemes. International Conference on Small Hydropower—Hydro Sri Lanka, p. 4.
Singal, S. K., Saini, R. P., & Raghuvanshi, C. S. (2008). Cost optimisation based on electro-mechanical equipment of canal based low head small hydropower scheme. The Open Renewable. Energy Journal, 1, 26–35. https://doi.org/10.2174/1876387100901010026
Singal, S. K., Saini, R. P., & Raghuvanshi, C. S. (2010). Analysis for cost estimation of low head run-of-river small hydropower schemes. Energy for Sustainable Development, 14(2), 117–126. https://doi.org/10.1016/j.esd.2010.04.001
Singh, G., & Chauhan, D. (2011). Development and simulation of mathematical modelling of hydraulic turbine. International Journal on Control System and Instrumentation., 02(2), 55–59.
Singh, V. K., & Singal, S. K. (2017). Operation of hydro power plants—A review. Renewable and Sustainable Energy Reviews, 69, 610–619. https://doi.org/10.1016/j.rser.2016.11.169
Singhal, M. K., & Kumar, A. (2015). Optimum design of penstock for hydro projects. International Journal of Energy and Power Engineering., 4(4), 216–226. https://doi.org/10.11648/j.ijepe.20150404.14
Stoll, B., et al. (2017). Hydropower modeling challenges hydropower modeling challenges. National Renewable Energy Laboratory (NREL), United States. https://doi.org/10.2172/1353003.
Voros, N. G., Kiranoudis, C. T., & Maroulis, Z. B. (2000). Short-cut design of small hydroelectric plants. Renewable Energy, 19(4), 545–563. https://doi.org/10.1016/S0960-1481(99)00083-X
Vougioukli, A. Z., Didaskalou, E., & Georgakellos, D. (2017). Financial appraisal of small hydro-power considering the cradle-to-grave environmental cost: A case from Greece. Energies, 10(4), 430. https://doi.org/10.3390/en10040430
Yildiz, V., & Vrugt, J. A. (2019). A toolbox for the optimal design of run-of-river hydropower plants. Environmental Modelling & Software, 111, 134–152. https://doi.org/10.1016/j.envsoft.2018.08.018
Acknowledgements
The Cameroon Ministry of Scientific Research and Innovation supported this work under the SETaDiSMA project. The SETaDiSMA project is part of the LEAP-RE programme. LEAP-RE has received funding from the European Union’s Horizon 2020 Research and Innovation Program under Grant Agreement 963530.
Funding
European Union’s Horizon 2020 Research and Innovation Program under Grant Agreement 963530 through LEAP-RE project.
Author information
Authors and Affiliations
Contributions
Conceptualization, D.T and B.A.; methodology, D.T. and B.A.; validation, J.K. and D.F.; formal analysis, D.T., B.A. and A.A.; investigation, B.A. and A.A.; writing—original draft preparation, B.A and D.T.; writing—review and editing, all authors; visualization, D.T.; supervision, D.T.; project administration, D.T.; funding acquisition, D.T. All authors have read and approved the final manuscript.
Corresponding author
Ethics declarations
Ethics approval and consent to participate
Not applicable.
Consent for publication
Not applicable.
Competing interests
The authors declare that they have no competing interests.
Additional information
Publisher's Note
Springer Nature remains neutral with regard to jurisdictional claims in published maps and institutional affiliations.
Appendices
Appendix 1
Small hydropower technical potential per country for 44 Sub-Saharan African countries (Korkovelos et al., 2018)
Country name | Natural mean annual runoff 999 (Billion m3) | Small Hydro (1.01–10 MW) | |
|---|---|---|---|
Identified sites (#) | Potential power (MW) | ||
Angola | 269.2 | 364 | 1330.5 |
Benin | 13.0 | 10 | 31.8 |
Botswana | 4.7 | 292 | 1218.6 |
Burkina Faso | 13.4 | 42 | 232.9 |
Burundi | 10.6 | 0 | 0.0 |
Cameroon | 284.9 | 142 | 459.2 |
Central African Republic | 124.5 | 94 | 287.7 |
Chad | 20.7 | 201 | 910.7 |
Congo | 199.2 | 96 | 335.1 |
Congo, DRC | 1075.0 | 673 | 2122.2 |
Cote d’Ivoire | 91.2 | 34 | 97.4 |
Djibouti | 1.3 | 0 | 0.0 |
Equatorial Guinea | 31.5 | 6 | 13.5 |
Eritrea | 14.9 | 16 | 42.9 |
Ethiopia | 314.3 | 292 | 947.8 |
Gabon | 235.2 | 129 | 412.1 |
Ghana | 63.9 | 21 | 100.8 |
Guinea | 182.5 | 71 | 235.6 |
Guinea-Bissau | 15.8 | 4 | 15.6 |
Kenya | 73.0 | 97 | 399.7 |
Lesotho | 9.8 | 17 | 60.9 |
Liberia | 144.9 | 37 | 114.3 |
Madagascar | 376.3 | 224 | 766.4 |
Malawi | 27.5 | 12 | 28.2 |
Mali | 37.8 | 89 | 413.4 |
Mauritania | 11.6 | 66 | 358.2 |
Mozambique | 140.6 | 151 | 578.6 |
Namibia | 8.0 | 371 | 1588.9 |
Niger | 11.4 | 167 | 759.6 |
Nigeria | 286.7 | 187 | 653.9 |
Rwanda | 8.7 | 0 | 0.0 |
Senegal | 7.5 | 34 | 153.7 |
Sierra Leone | 113.2 | 48 | 166.0 |
Somalia | 28.6 | 141 | 565.9 |
South Africa | 76.2 | 583 | 2688.2 |
South Sudan | 39.9 | 125 | 635.9 |
Sudan | 34.0 | 435 | 2105.4 |
Appendix 2
Small hydropower definition and classification in some selected countries and organizations (Bhat & Prakash, 2014; Elbatran et al., 2015; Mishra et al., 2012; Ohunakin et al., 2011)
Country/organization | Small-scale hydro as defined by installed capacity (kW) |
|---|---|
IN-SHP | < 10,000 |
UNIDO | < 10,000 |
ESHA | < 15,000 |
China | < 50,000 |
Philippines | < 50,000 |
Sweden | < 15,000 |
The USA | < 100,000 |
India | < 25,000 |
Brazil | < 30,000 |
New Zealand | < 50,000 |
The UK (NFFO) | < 5000 |
EU Linking Directive | < 20,000 |
Norway | < 10,000 |
Australia | < 20,000 |
Colombia | < 20,000 |
Indonesia | < 50,000 |
Vietnam | < 25,000 |
Canada | < 50,000 |
Rights and permissions
Open Access This article is licensed under a Creative Commons Attribution 4.0 International License, which permits use, sharing, adaptation, distribution and reproduction in any medium or format, as long as you give appropriate credit to the original author(s) and the source, provide a link to the Creative Commons licence, and indicate if changes were made. The images or other third party material in this article are included in the article's Creative Commons licence, unless indicated otherwise in a credit line to the material. If material is not included in the article's Creative Commons licence and your intended use is not permitted by statutory regulation or exceeds the permitted use, you will need to obtain permission directly from the copyright holder. To view a copy of this licence, visit http://creativecommons.org/licenses/by/4.0/.
About this article

Cite this article
Tsuanyo, D., Amougou, B., Aziz, A. et al. Design models for small run-of-river hydropower plants: a review. Sustainable Energy res. 10, 3 (2023). https://doi.org/10.1186/s40807-023-00072-1
Received:
Accepted:
Published:
DOI: https://doi.org/10.1186/s40807-023-00072-1